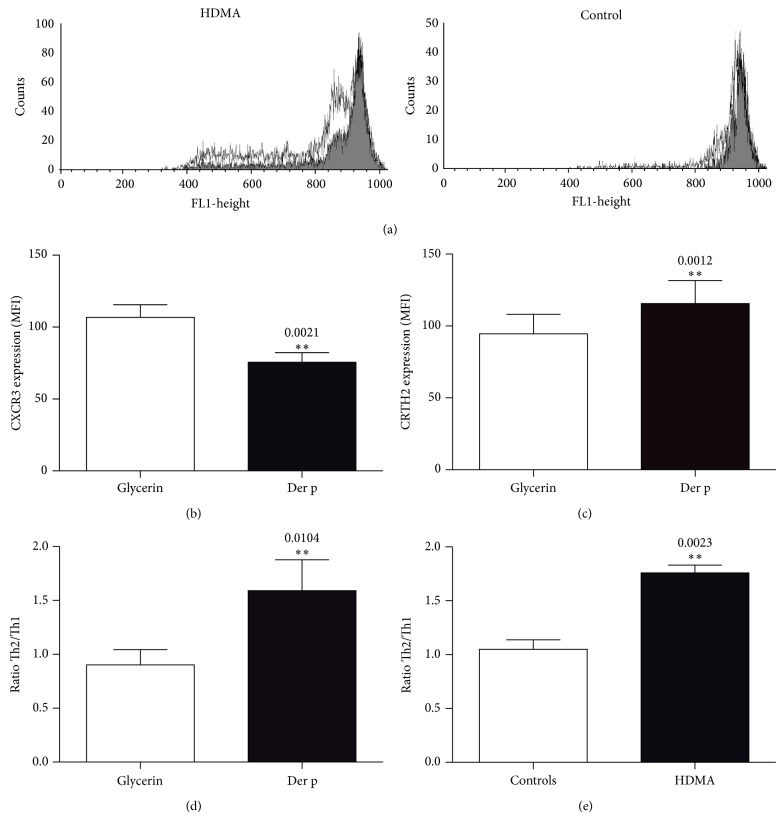
Figure 2.
Flow-cytometric analysis of T cell proliferation and Th cell polarization. CFSE-labeled CD4+ T cells from HDM-allergic or HDM-nonallergic individuals were cultured with Der p or glycerin as described in Section 2. T cell division was analyzed by flow cytometry and illustrated as a CFSE division profile (a). Dead cells were excluded based on their light scattering properties. Nondividing CD4+ T cells in the absence of allergen are shown as dark grey histograms. CD4+ T cells that have divided in response to Der p are shown in light grey histograms, based on CFSE dilution peaks. One representative experiment of three is illustrated. In vitro polarization of human Th1 and Th2 precursors following 11 days of culture with glycerin or Der p was determined by flow cytometry using Alexa-conjugated Abs for human CXCR3 (b) or CRTH2 (c), respectively. Data are expressed as geometric mean (±SEM) fluorescence intensity (MFI). P values are indicated. HDMA = house dust mite-allergic donors. Th2/Th1 ratio of CD4+ T cells from HDM-allergic donors following 11 days of culture with glycerin or Der p (d), n = 6; Th2/Th1 ratio of Der p-stimulated CD4+ T cells from nonallergic and HDM-allergic individuals (e), n = 6 for controls; n = 10 for HDMA.

