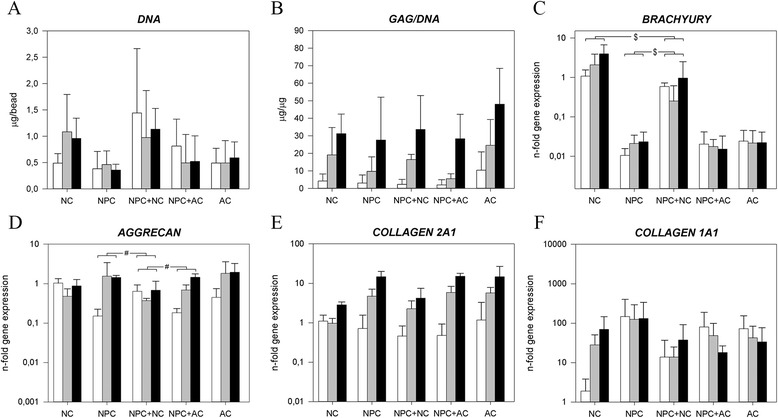
Figure 4.

Notochordal cells (NCs) and nucleus pulposus cells (NPCs) in coculture (control: articular chondrocytes (ACs)). Depiction of the (A) DNA content and (B) glycosaminoglycan (GAG) content normalized to DNA (GAG/DNA) and the relative gene expression of (C) NC marker brachyury; (D) aggrecan; (E) collagen, type II, α1 (collagen 2A1); and (F) collagen, type I, α1 (collagen 1A1). White bar = day 1, gray bar = day 15, black bar = day 28. $ P < 0.05, significant difference in the increase in gene expression in time between groups. # P < 0.001, significant difference in the increase in gene expression in time between groups. Only relevant comparisons are displayed.
