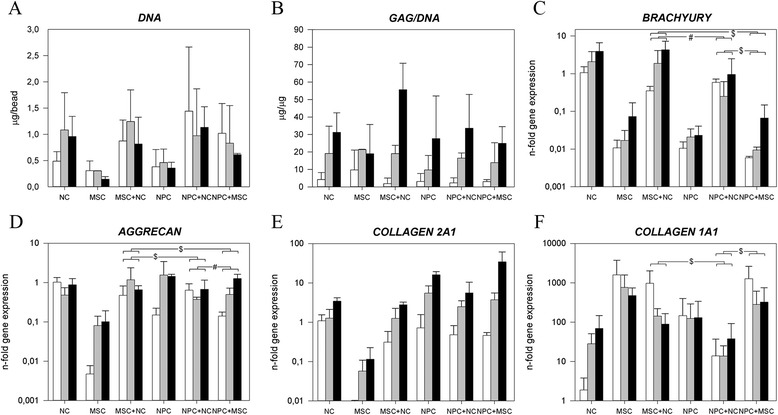
Figure 5.

Comparison of the effect of notochordal cells (NCs) on nucleus pulposus cells (NPCs) and mesenchymal stromal cells (MSCs). Depiction of the (A) DNA content and (B) glycosaminoglycan (GAG) content normalized to DNA (GAG/DNA) and the relative gene expression of (C) NC marker brachyury; (D) aggrecan; (E) collagen, type II, α1 (COL2A1); and (F) collagen, type I, α1 (COL1A1). White bar = day 1, gray bar = day 15, black bar = day 28. $ P < 0.05, significant difference in the increase in gene expression in time between groups. # P < 0.001, significant difference in the increase in gene expression in time between groups. Only relevant comparisons are displayed.
