
Figure 5.
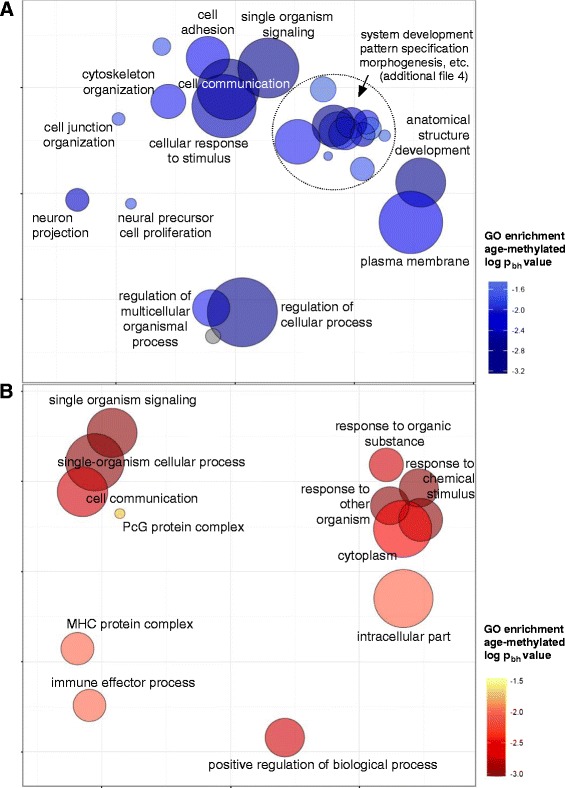
Gene ontology (GO) categories significantly enriched in genes harbouring age-modified CpG sites. Summary of GO categories presented in a two-dimensional space derived by applying multidimensional scaling to a pairwise distance matrix of the semantic similarities in GO terms. (A) Enriched GO categories in age-methylated CpG sites (blue); (B) Enriched GO categories in age-demethylated sites (red); colour scales represent the Benjamini-Hochberg corrected log P value for the enrichment (log P −2 equals P = 0.01). Circle sizes indicate the number of genes of each GO term (set size). Detailed information on enriched GO categories, number of age-modified loci per GO term and P values is presented in Additional file 3 (for age-methylated CpGs) and Additional file 4 (for age-demethylated CpGs). For this visualization approach, highly similar GO categories are grouped together and cluster representatives are selected based on P values and dispensability scores. Each GO term receives a coordinate so that more semantically similar GO terms get closer in the plot [58]. To be regarded as significant, any GO term requires coincidence of at least five genes and a pbh = 0.05.