Figure 1.
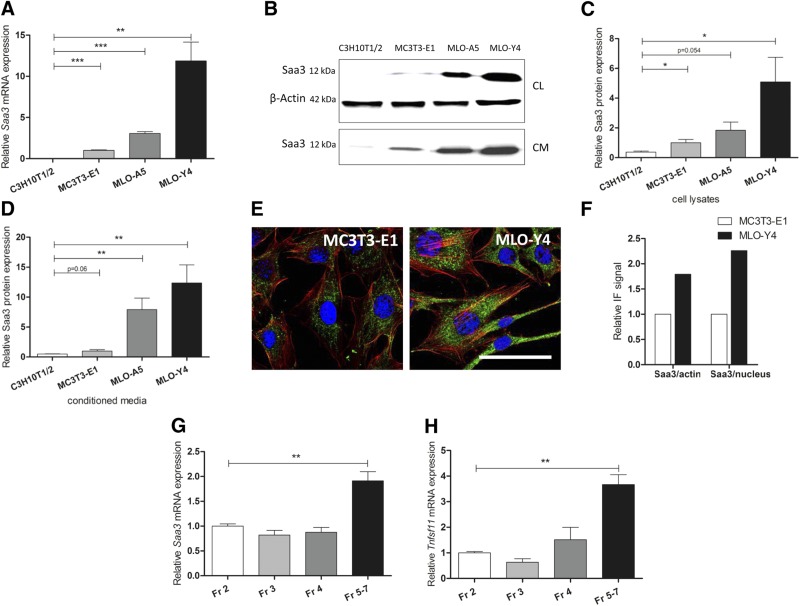
Mouse Saa3 is highly expressed in osteocytes. Expression pattern of Saa3 on mRNA level (A) and protein level (B–D). Representative Saa3 immunoblots are shown for the cellular (CL, with β-actin as reference, upper blots) and the serum-free conditioned media (CM) fraction (related to media volume, lower blot) (B). Quantification is shown of the cellular lysate fraction (C) and of the conditioned media fraction (D). E) Comparison of Saa3 (green) levels by IF in MLO-Y4 cells and MC3T3-E1. Scale bar, 50 µm. F) Quantification of total Saa3 IF signal found in (E) referenced to total nuclear (blue) or to total F-Actin (red) IF signal. G) Saa3 RT-qPCR analysis of primary mouse osteoblasts [Fraction (Fr) 2–4] or late osteoblasts to early osteocytes (Fr 5–7) obtained by sequential digestion of long bones. H) The osteoblast-to-osteocyte differentiation pattern of the cellular fractions is supported by increasing Tnfsf11 mRNA levels in cell fractions Fr 5–7. 18S rRNA is a reference gene for RT-qPCR analysis; MC3T3-E1 is set to 1, and all other cell lines are referred to as fold change to MC3T3-E1. In (G) and (H), Fr 2 is set to 1; all other cell fractions are referred to as fold change to Fr 2. Values are represented as the mean ± sd; for all experiments n = 3. *P ≤ 0.05; **P ≤ 0.01; ***P ≤ 0.001.

