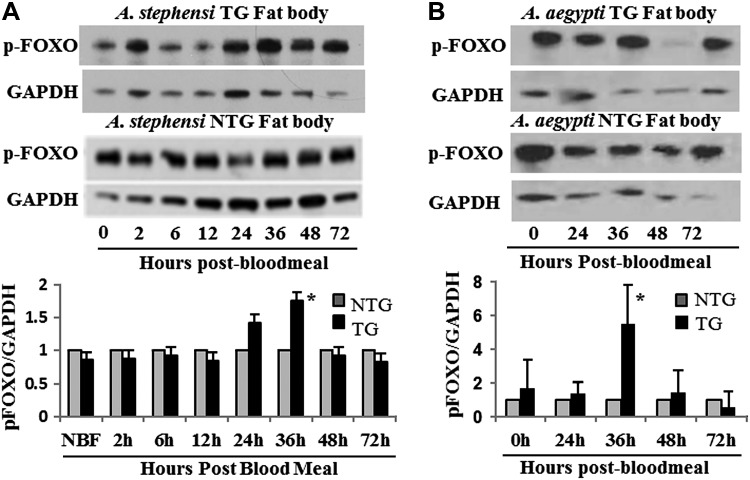
Figure 2.
Phosphorylation of the downstream IIS signaling molecule FOXO by myr-Akt. A) Fat bodies from 3 to 5 days old TG and NTG A. stephensi females were dissected to assess the phosphorylation of the downstream IIS molecule FOXO (pFOXO). Relative levels of pFOXO were measured by immunoblotting using pFOXO and GAPDH (control) antibodies (top). Shown is a representative immunoblot showing pFOXO levels throughout a reproductive cycle. In the bottom graph, the relative levels of pFOXO (determined by the ratio of pFOXO to GAPDH controls) are shown. To highlight differences between TG and NTG samples, pFOXO levels in the NTG controls were normalized to 1. B) Levels of pFOXO in TG and NTG Ae. aegypti are shown in a representative immunoblot and densitometry analysis graph as described in (A). Each experiment was replicated a minimum of 3 times. Asterisks above bar in each graph indicates a significant difference (P < 0.05) between TG and NTG relative to GAPDH control.

