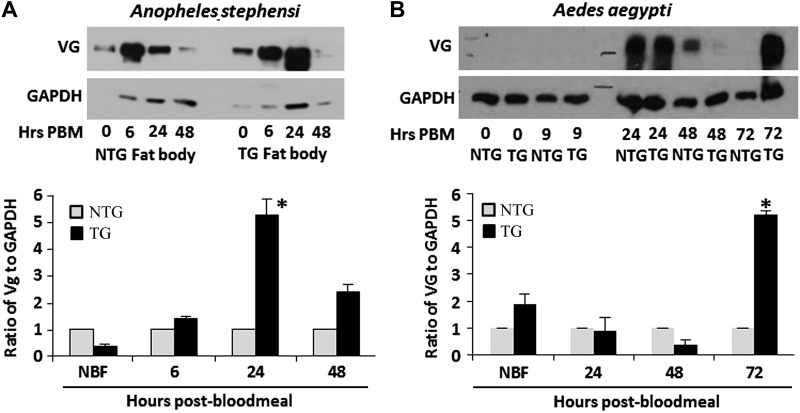
Figure 4.
Impact of myr-Akt expression on VG synthesis. A) Representative immunoblot of VG protein levels (VG) in the abdominal body walls/fat body of A. stephensi during a reproductive cycle (top). Graph indicates relative levels of A. stephensi VG (determined by the ratio of VG to GAPDH controls). To highlight differences between TG and NTG samples, VG levels in the NTG controls were normalized to 1. B) Representative immunoblot of VG protein levels (VG) in the abdominal body walls of Ae. aegypti during a reproductive cycle (top). Immunoblots were replicated a minimum of 3 times.

