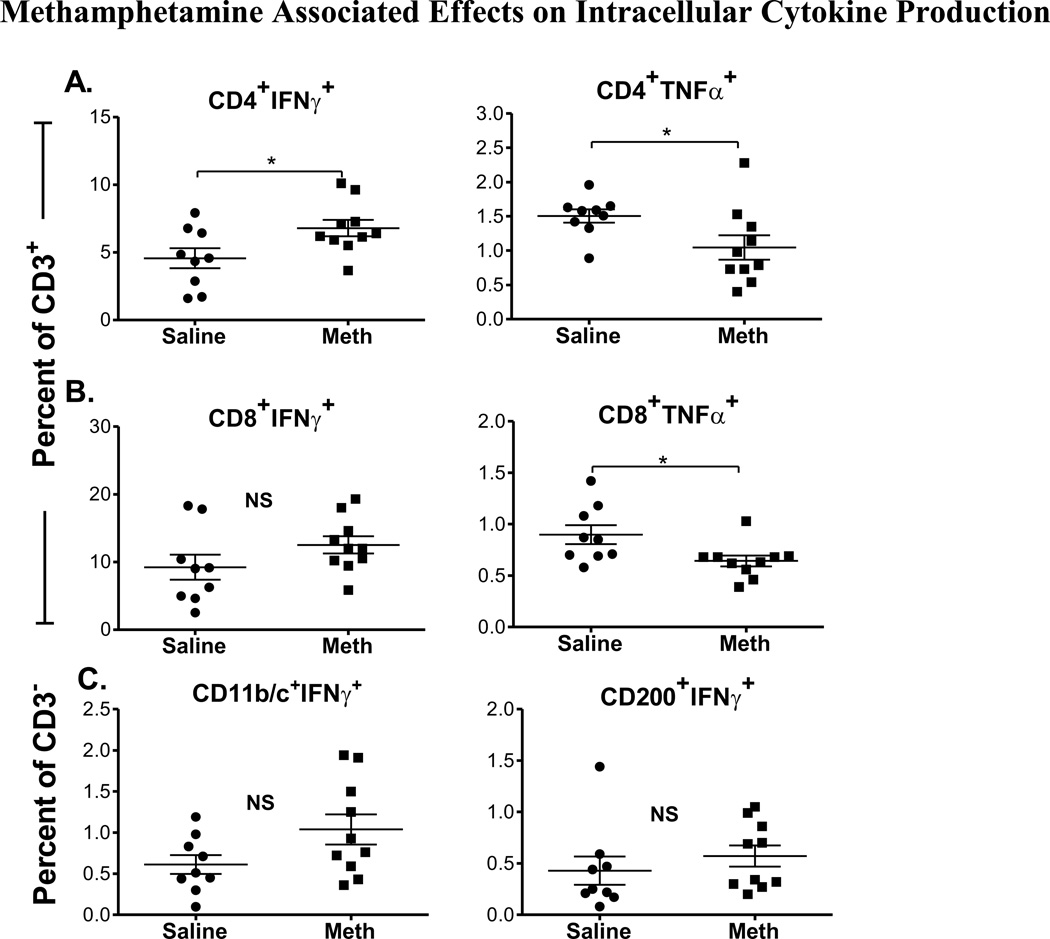
Figure 4. Methamphetamine Associated Effects on Intracellular Cytokine Production.
Splenocytes from methamphetamine (meth) self-administering rats and saline-yoked controls were isolated and stimulated with PMA and Ionomycin. We compared intracellular cytokine production by live CD3+ and CD3− subpopulations in rats that self administered methamphetamine and saline controls. The percentage of cells that produce IFN-γ (left) and TNF-α (right) for (A) CD3+CD4+ and (B) CD3+CD8+ T cells are shown for saline (circles) and methamphetamine (squares) groups. (C) The percentage of IFN-γ+ producing CD3− CD11b/c+ (monocytes) and CD3−CD200+ B cells is shown for saline (circles) and methamphetamine (squares) groups. *, P <0.05, Student’s t-test. (NS) indicates that differences were not significant.

