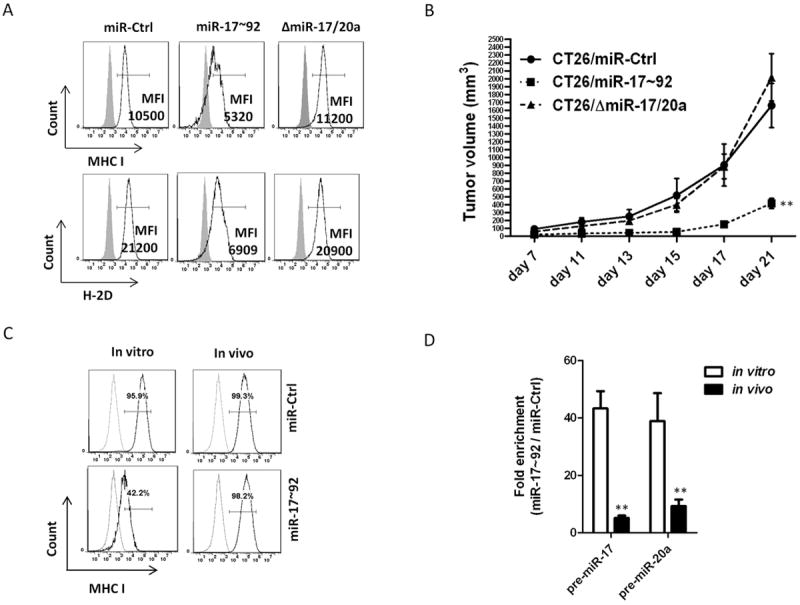
Figure 3. MiR-17/20a enhances NK cell recognition by suppressing the expression of MHC class I.

(A) The expression levels of MHC class I (H-2D/H-2K) and H-2D in CT26/miR-Ctrl, CT26/miR-17~92 and CT26/ΔmiR-17/20a cell lines were analyzed by flow cytometry. The mean fluorescence intensity (MFI) of MHC class I+ or H-2D+ cells is indicated.
(B) Growth curves of CT26/miR-Ctrl, CT26/miR-17~92 and CT26/ΔmiR-17/20a tumors in BALB/c mice (5 mice per group). Error bars represent standard deviation (±SD) (two-way ANOVA; ** p<0.01).
(C) The expression levels of MHC class I (H-2D/H-2K) in CT26/miR-Ctrl and CT26/miR-17~92 recovered from tumors (14 days after subcutaneous injection of CT26/miR-Ctrl or CT26/miR-17~92 monoclonal cells into BALB/c mice) were analyzed by flow cytometry.
(D) Expression of pre-miR-17, and pre-miR-20a in tumor cells recovered from tumors (14 days after subcutaneous injection of CT26/miR-Ctrl or CT26/miR-17~92 monoclonal cells into BALB/c mice) was reduced compared to in vitro cultures of the same tumor cell lines as measured by real-time PCR. Error bars represent standard deviation (±SD) (Student’s t-test; ** p<0.01).
