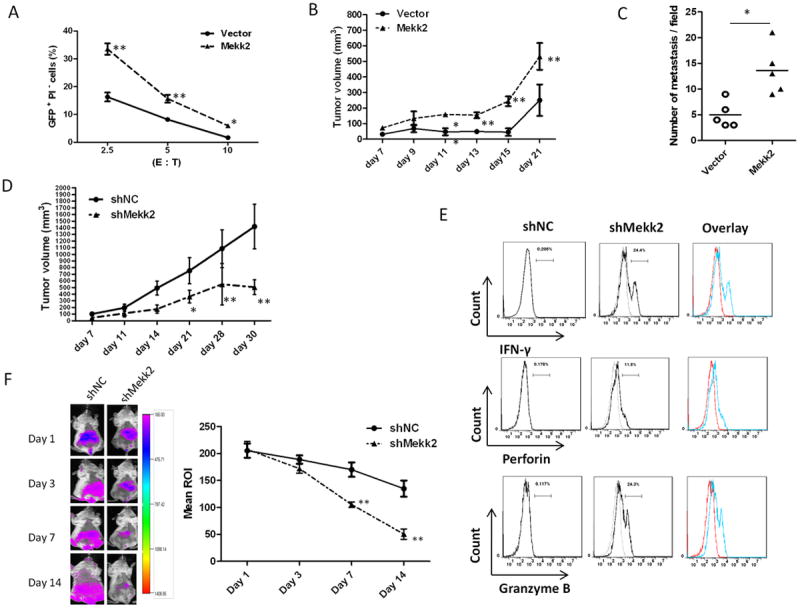
Figure 5. Activation of Mekk2/Erk5 pathway is required for tumor cells to escape from NK cell-mediated immune surveillance.

(A) The cytotoxicity of purified DX5+ splenic leukocytes from BALB/c mice to CT26/miR-17~92 cells transfected with control vector or pEh-Mekk2-YFP in vitro for 48 h. The percentage of GFP+PI- cells was analyzed after co-culture of spleen effector cells (E) with target cells (T) at different ratios for 3 h.
(B) Growth curves of CT26/miR-17~92 tumors in BALB/c mice. CT26/miR-17~92 cells transiently transfected with control vector or pEh-Mekk2-YFP. 48 hours after transfection, 5×10⁵ transfected cells were subcutaneously injected into BALB/c mouse (5 mice per group). Tumors were measured with a caliper, and tumor volumes were calculated using the formula length × width2.
(C) Histogram shows the number of metastases per field of sectioned lung. Tissues harvested on day 14 after BALB/c mice having been intravenously injected with CT26/miR-17~92 monoclonal cells transiently transfected with control vector or pEh-Mekk2-YFP. Error bars represent median value (Student’s t-test, *p<0.05).
(D) Growth curves of shNC and shMekk2 tumors in BALB/c mice that were subcutaneously injected with shNC cells or shMekk2 cells stably expressing shRNA targeting Mekk2 (5×10⁵ per mice, 5 mice per group). Error bars represent standard deviation (±SD) (Two-way ANOVA; **p<0.01).
(E) FACS analysis shows IFN-γ, Perforin and Granzyme B in DX5+CD3- NK cells from shMekk2 tumor compared with shNC tumor on day 14 after subcutaneous injection of BALB/c mice. A representative graph (n=5) is shown.
(F) shNC and shMekk2 cell lines were labeled with DiR dye. The labeled cells were intravenously injected into 6-week old female BALB/c mice. Tumor cell metastasis was monitored using a live imaging system (left panel shows a sample image of a mouse at each time point). The means of DiR fluorescent signal intensity (right panel) at diffident time points (Mean ROI = Sum Intensity/Area, n=5). Error bars (A, B, D, F) represent standard deviation (±SD) (Two-way ANOVA; **p<0.01).
