Figure 2.
Prospective studies.
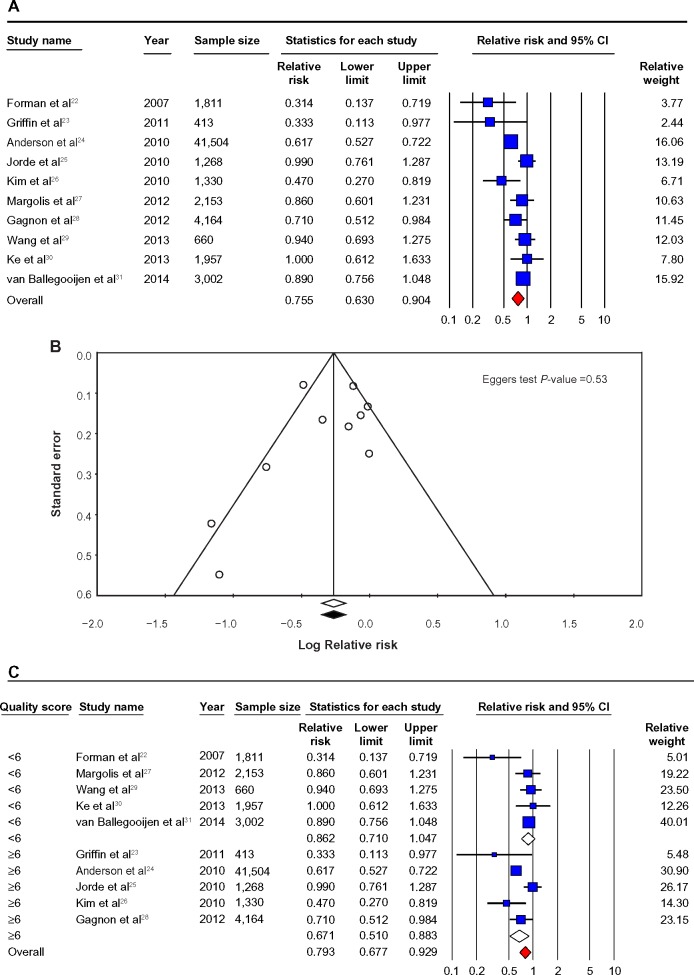
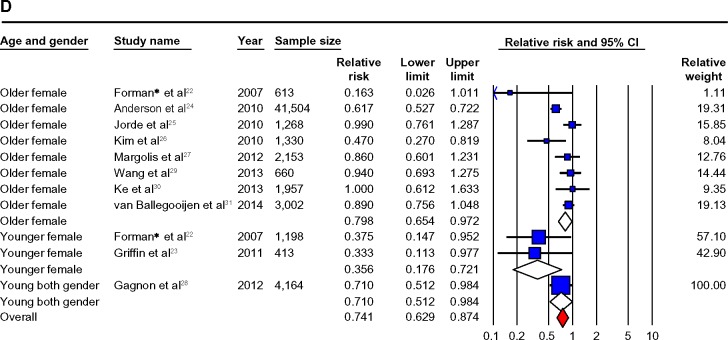
Notes: (A) Prospective studies of vitamin D and hypertension risk: the effect of higher vitamin D (measured as quartiles of 25OHD) on hypertension risk expressed as relative risk (RR) for individual studies (blue) and the calculated overall RR (red). (B) Funnel plot showing standard error by log RR for the prospective studies. (C) Prospective studies of vitamin D and hypertension risk sub-groups: the effect of higher vitamin D (measured as quartiles of 25OHD) on hypertension risk stratified by quality score expressed as RR for individual studies (blue), sub-groups total (white) and the calculated overall RR (red). (D) Prospective studies of vitamin D and hypertension risk sub-groups: the effect of higher vitamin D (measured as quartiles of 25OHD) on hypertension risk stratified by age and gender expressed as RR for individual studies (blue), sub-group total (white) and the calculated overall RR (red). *Studies published in one paper.
Abbreviation: CI, confidence Interval.


