
Figure 3.
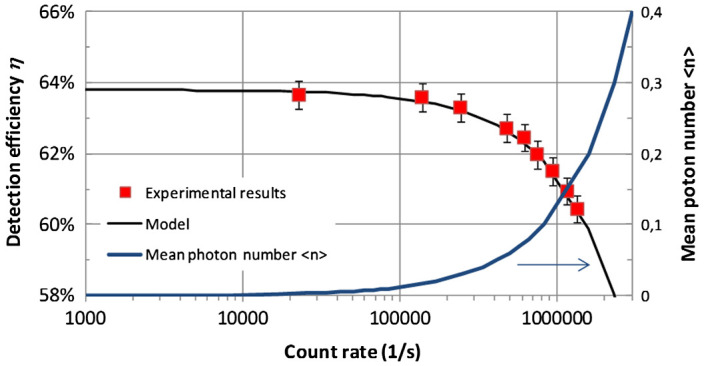
Detection efficiency dependence from the photon count rate. The experimental results (red squares) are best described with η 0 = 63.8% and t dead = 75 ns. (The colour version of this figure is included in the online version of the journal.)