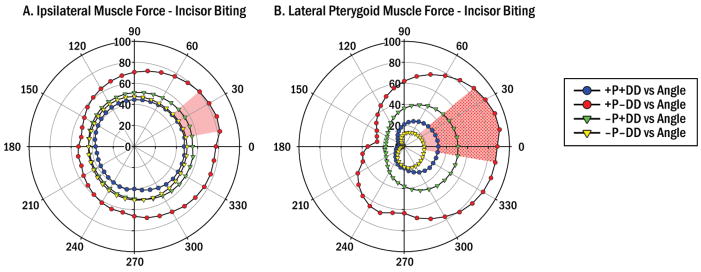
Figure 3.

Mean predicted muscle forces during incisor biting in 4 diagnostic groups with/without (+/-) pain (P) and TMJ disc displacement (DD). Circumferential scale indicates biting angle in occlusal plane (θxz, Fig. 1). Radial scales indicate muscle force magnitude (%) relative to applied bite-force (100%). The +P-DD group showed significantly higher (A) Ipsilateral muscle forces than other groups (all P<0.01, red area) for: θxz=10–40°; and (B) Lateral pterygoid muscle forces than the –P-DD (P<0.01, red area) and +P+DD (P<0.05, stippled area) groups for: θxz=0–40° and ≥350°.
