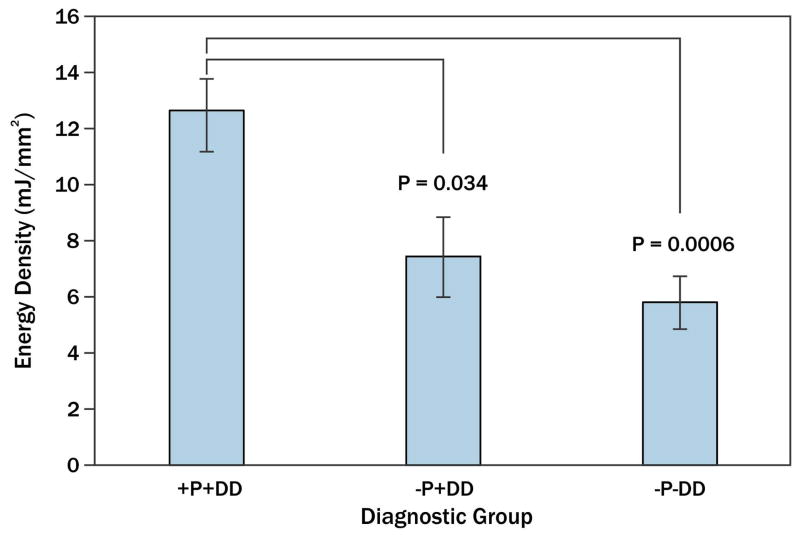
Fig. 4.
TMJ energy densitites in three TMD diagnostic groups – Mean energy densities for subjects with (+) and without (−) pain (P) and disc displacement (DD) are shown, where vertical lines indicate standard errors above and below the means. Results for the +P+DD groups were significantly higher compared to −P+DD (p=0.034) and −P−DD (p=0.0006) groups.

