
Figure 8.
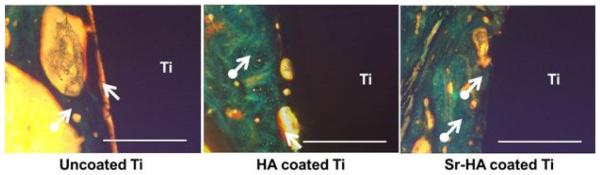
Optical photomicrograph of a longitudinal section of uncoated Ti, HA coated Ti, and Sr-HA coated Ti implants showing the development of new bone formation on the surface of implants after 16 weeks. The scale bar represents 400μm.
Official websites use .gov
A
.gov website belongs to an official
government organization in the United States.
Secure .gov websites use HTTPS
A lock (
) or https:// means you've safely
connected to the .gov website. Share sensitive
information only on official, secure websites.
Optical photomicrograph of a longitudinal section of uncoated Ti, HA coated Ti, and Sr-HA coated Ti implants showing the development of new bone formation on the surface of implants after 16 weeks. The scale bar represents 400μm.