


Table 1.
Spectroscopic and pKa data of the cAMR and cAMR6G series. Quantum yields were measured relative rhodamine B or rhodamine 6G in ethanol.
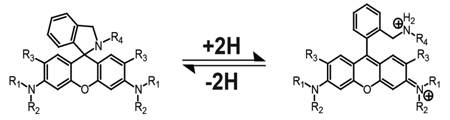 | |||||||
|---|---|---|---|---|---|---|---|
| Compound | R1 | R2 | R3 | R4 | pKa | Mol.Abs. | Φ |
| cPr-AMR | Et | Et | H |  |
6.1 | 96,200 | 0.09 |
| cBu-AMR | Et | Et | H |  |
6.7 | 89,100 | 0.05 |
| cPnt-AMR | Et | Et | H |  |
7.1 | 92,700 | 0.05 |
| cHex-AMR | Et | Et | H |  |
7.4 | 107,500 | 0.09 |
| cPr-AMR6G | Et | H | Me |  |
7.0 | 114,000 | 0.68 |
| cBu-AMR6G | Et | H | Me |  |
7.7 | 53,100 | 0.68 |
| cPnt-AMR6G | Et | H | Me |  |
8.2 | 76,100 | 0.68 |
| cHex-AMR6G | Et | H | Me |  |
8.5 | 79,600 | 0.48 |