
Figure 1.
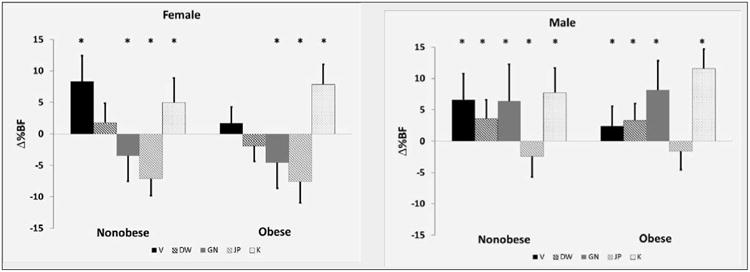
Mean Δ%BF (mean of within subject differences from DXA) for females (left) and males (right). Visser (V) shown by solid black bars, Durnin and Womersley (DW) shown by hashed black bars, Gause_Nilsson (GN) shown by solid gray bars, Jackson and Pollock (JP) shown by hashed gray bars and Kwok (K) shown by dotted bars. Standard deviations are provided. * Denotes significantly different from DXA for each group (p<0.05)