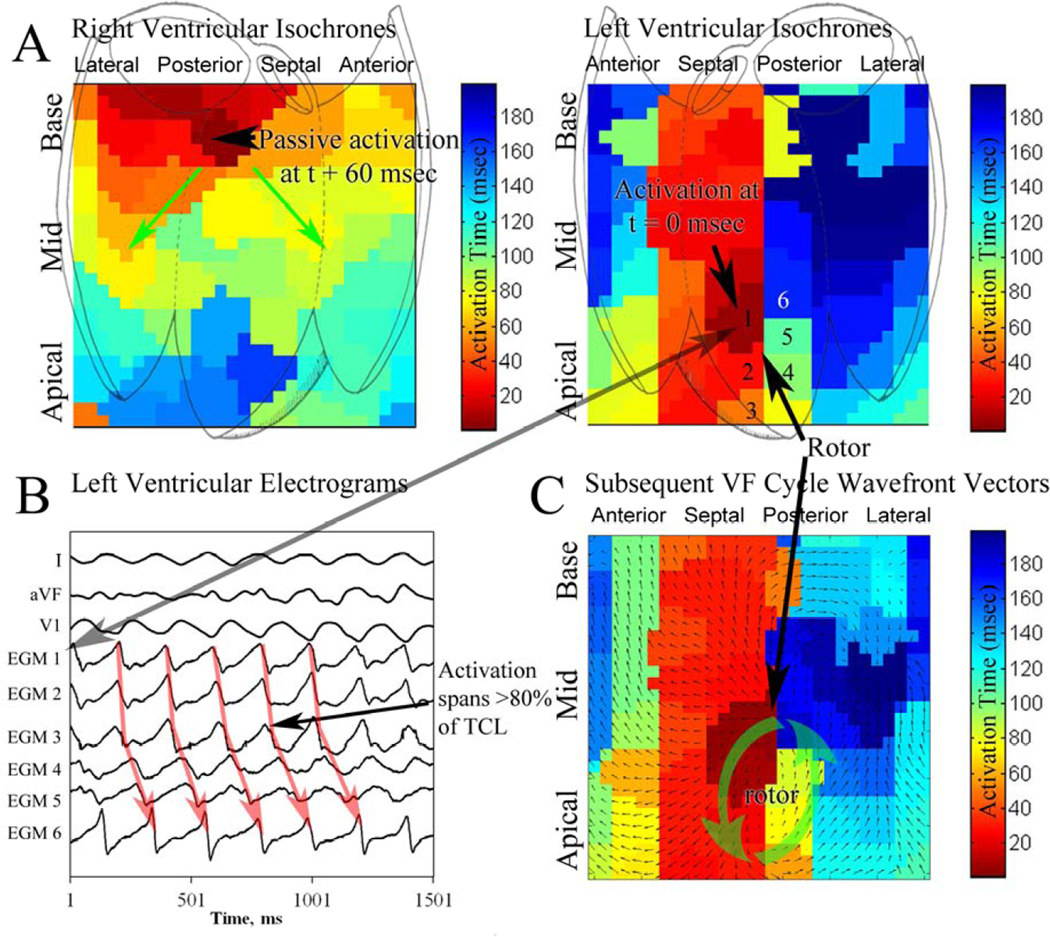
Figure 3. Biventricular VF analysis showing LV rotor.
(A) Isochronal analysis of the RV and LV during ventricular fibrillation in a 73 year old patient, EF 25%, presenting for drug-refractory ventricular tachycardia. LV isochrones show a rotor (CL 220 msec) in the septal LV. This rotor persisted for 15 continuous rotations; rotor activity was seen in 72% of all VF cycles in this patient. (B) Basket electrograms during VF, numbered (1–6) near the rotor core. Note that activation spans <80% of the VF cycle length. (C) Wavefront vector analysis of the subsequent VF cycle, showing consistent rotation about the core with radial activation of distant tissue.

