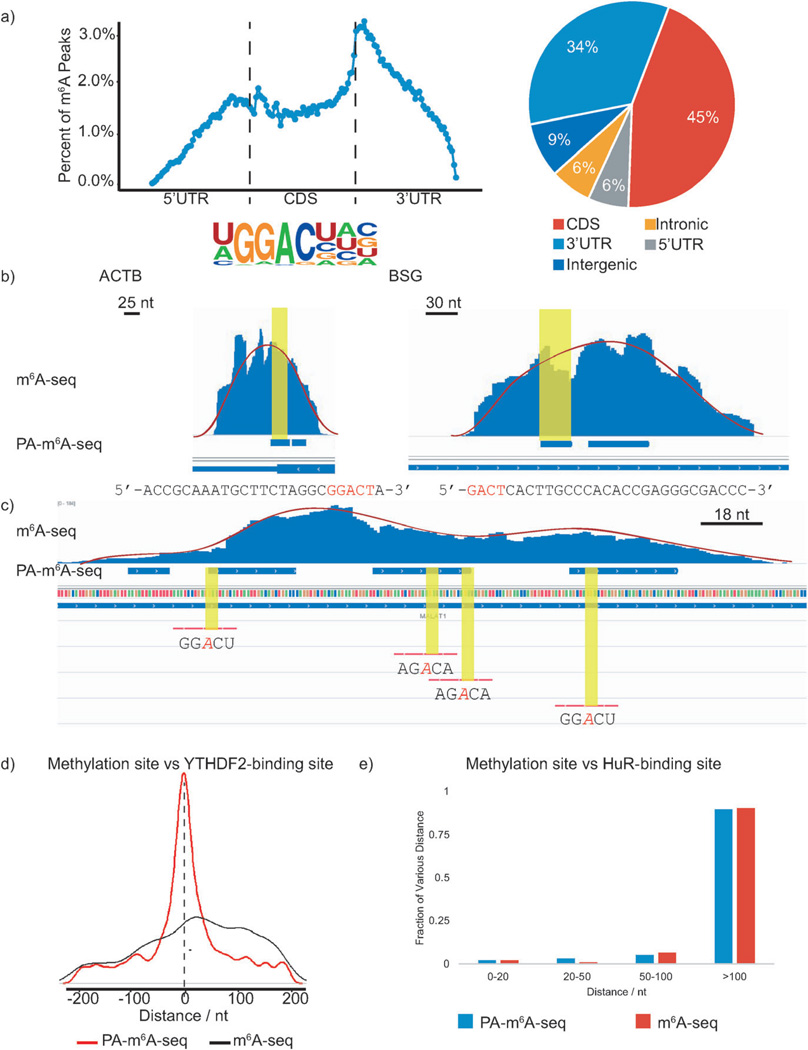
Figure 2.
PA-m6A-seq applied to poly(A)-tailed RNA purified from HeLa cells. In following figures, blue bars represent methylation sites identified by PA-m6A-seq, whereas blue ‘peaks’ above those bars are from normal m6A-seq. a) Validation of PA-m6A-seq strategy. Metagene profile and pie-chart of the enrichment of RNA segments are consistent with previous reported distribution of m6A, and the motif search yielded GGACU as the predominant one, which was the same as the result from normal m6A-seq. b) Comparison of predicted methylation sites in β-actin (ACTB) and homo sapien basigin (BSG) from PA-m6A-seq with peaks from normal m6A-seq and single sites by SCARLET. Sequences of predicted sites are shown below, consensus motif containing m6A in red. All input background of normal m6A-seq has been subtracted. Both sites were verified by SCARLET. c) Multiple methylation sites in MALAT1 transcript. The methylation sites confirmed by SCARLET, which were covered by peaks from normal m6A-seq, were also identified by PA-m6A-seq with higher resolution. Yellow regions indicate the RRACH motif. Red lines are the probes used to verify these sites with SCARLET. d) Distance of predicted methylation sites using PA-m6A-seq versus peaks obtained from normal m6A-seq to YTHDF2-binding sites. e) Distance of predicted methylation sites obtained from PA-m6A-seq versus peaks obtained from normal m6A-seq to HuR-binding sites.

