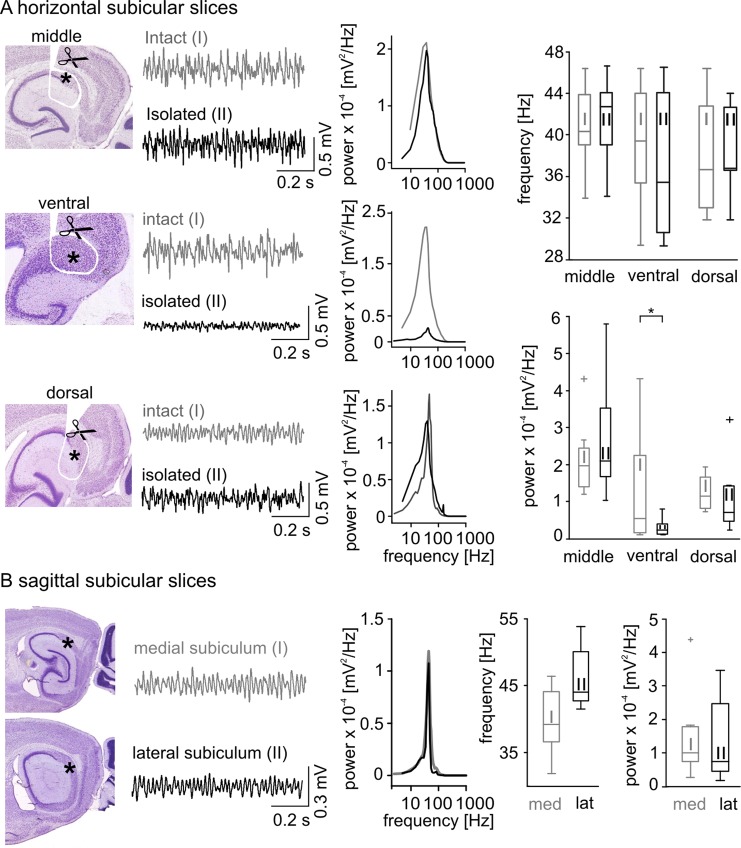
Fig 2. Gamma frequency network oscillations within the subiculum.
(A) Gamma frequency oscillations were found in all of the examined subicular regions (middle, ventral, and dorsal). Sketches illustrate horizontal (middle, ventral and dorsal) slice preparation. The position of the scissors indicate the cuts made around the perimeters of the subicular region with the resulting subicular minislices marked by an asterisk. (A, right next to the sketch) Two example LFP recordings obtained from intact (grey, I, top trace) and isolated (black, II, bottom trace) middle (top), ventral (middle) and dorsal (bottom) slices are displayed together with the corresponding power spectra (A, middle column, color code according to the example traces). (A, right) The population data of the oscillatory frequency (top histogram) and spectral power (bottom histogram) exhibits no significant difference of the intact compared to the isolated subicular slices in network oscillatory gamma frequency as well as in spectral power (values and numbers in Table 1) except for the ventral subicular slices (p = 0.034, significance level indicated by asterisk). (B) Gamma frequency oscillations recorded from the medial (grey, I) and lateral (black, II) subiculum within the sagittal slice preparations. Same type of illustration as in (A), the subicular region is marked by an asterisk. The population histogram for frequency and power (values and numbers in Table 2) did not reveal a significant difference.

