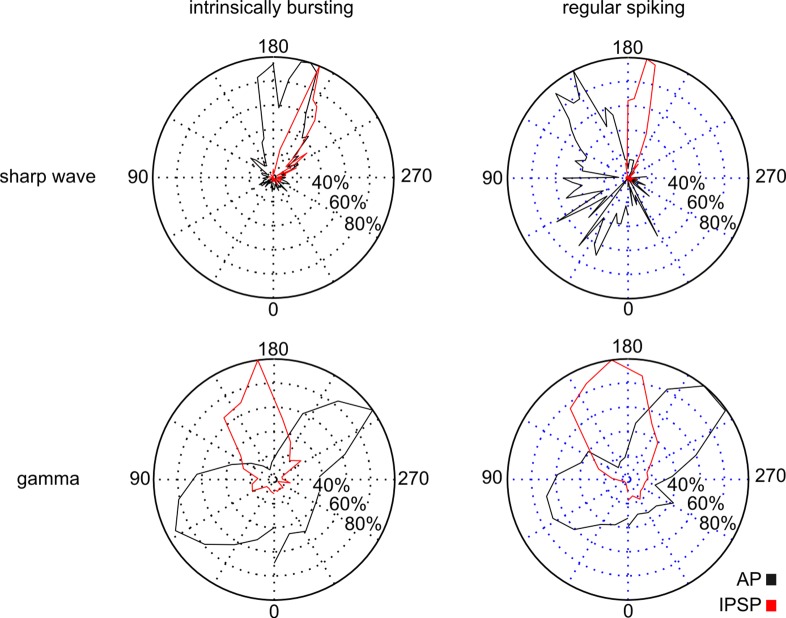
Fig 7. Phase distribution of APs and synaptic inhibition during SPW and gamma frequency oscillations.
APs (black) and synaptic inhibition (red) of IB (left column) and RS (right column) cells projected on a standard phase polar diagram for SPW (upper row; 80 ms projected time window) and gamma frequency oscillations (lower row; 24 ms projected time window). The peak of network activity is located at 180°, the ascending slope is encoded with lower, the descending with higher values. APs are illustrated based on the cumulative AP time histograms (Figs 3B, 4B, 5A and 6A) with respect to the projected time window, synaptic inhibition is represented by the distribution of time points for maximal deflection in the cellular cumulative IPSPs (Figs 3C, 4B, 5C and 6B). All values are normalized to the respective maximum activity level. During SPW oscillations RS cells, spontaneously active or depolarized, exhibit an earlier AP activity (n = 11) as well as an earlier peak of synaptic inhibition (n = 4) with respect to the IB cell phase distribution (n = 16, n = 3, respectively). Hence, according to the different phase distributions the activity of both cell types is separated in the time domain during SPW network activity. In contrast, during gamma frequency oscillations both subicular cell classes reveal comparable activity pattern with two distinct AP peaks (IB: n = 8; RS: n = 9) and an intermediate prominent inhibition (IB: n = 5; RS: n = 5).

