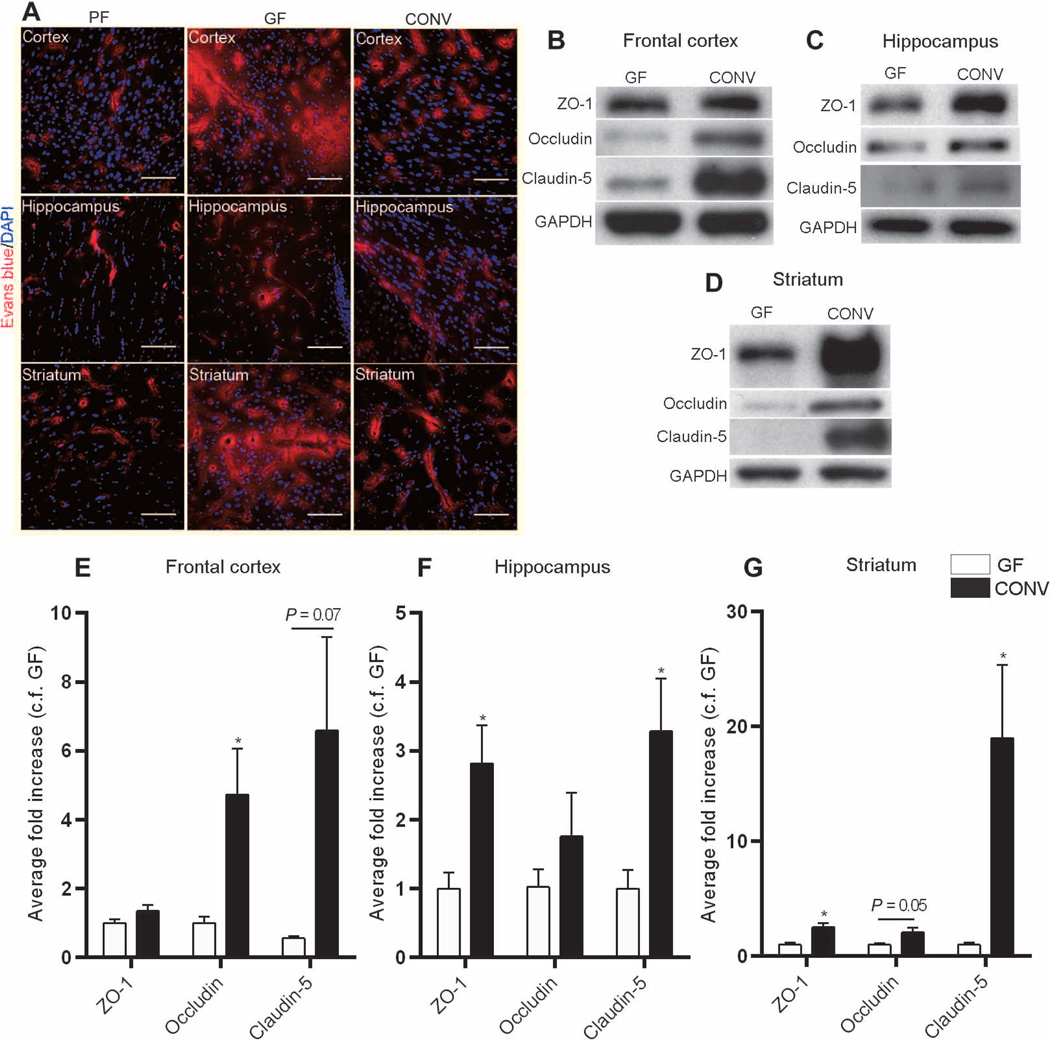
Fig. 5. Microbial colonization of the gut changes BBB integrity.
(A) Representative images from three mouse brain regions (frontal cortex, striatum, and hippocampus) showing Evans blue dye (red) in pathogen-free (PF) mice, germ-free (GF)mice, and germ-free mice colonized with pathogen-free flora for 14days (CONV). Blue, DAPI (nuclear staining). Scale bars, 50 µm. (B to G) Quantitative analysis of ZO-1, occludin, and claudin-5 expression in the frontal cortex, striatum, and hippocampus of germ-free and CONV mice. Data were normalized for GAPDH expression and expressed as fold change, fold control (c.f.) GF. Values represent means ± SEM (four to six mice per group). *P < 0.05 by Student’s t test compared to the germ-free control.

