
Fig 3. Unweighted UniFrac principal coordinates analysis (PCoA) plot.
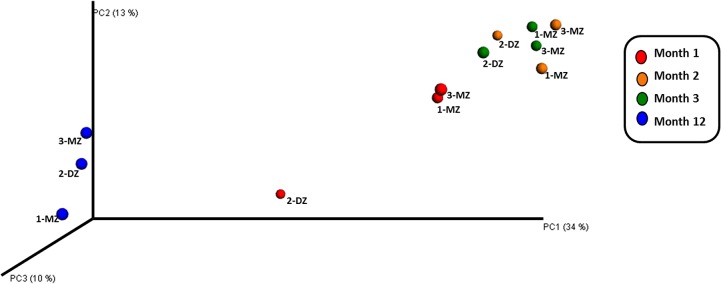
Unweighted UniFrac PCoA plot derived from 454 sequencing of V4 rRNA sequences from triplet set A fecal samples at month 1, 2, 3 and 12 comparing the presence/absence of operational taxonomic units (OTUs) and their phylogenetic relatedness.