Figure 2.

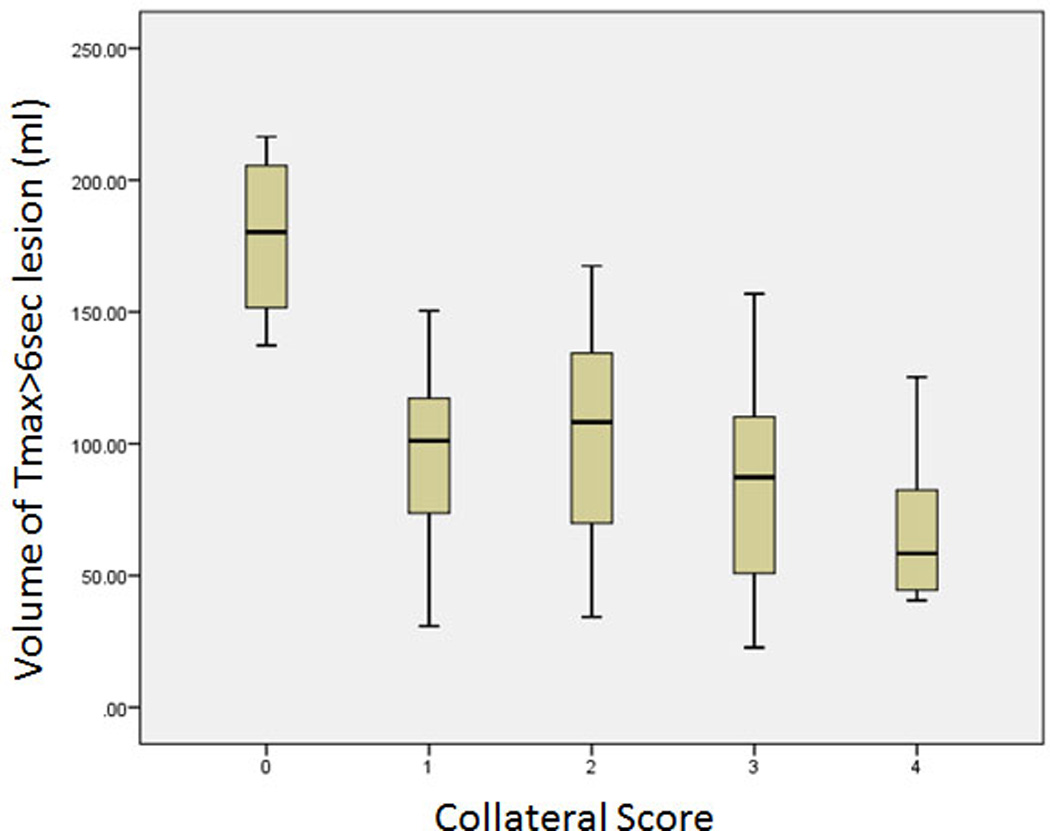
Box plots showing relationship of volume of tissue with Tmax ≥ 6 seconds to collateral score. Box represents interquartile range, line within box represents median value, and bars show ranges of values.

Box plots showing relationship of volume of tissue with Tmax ≥ 6 seconds to collateral score. Box represents interquartile range, line within box represents median value, and bars show ranges of values.