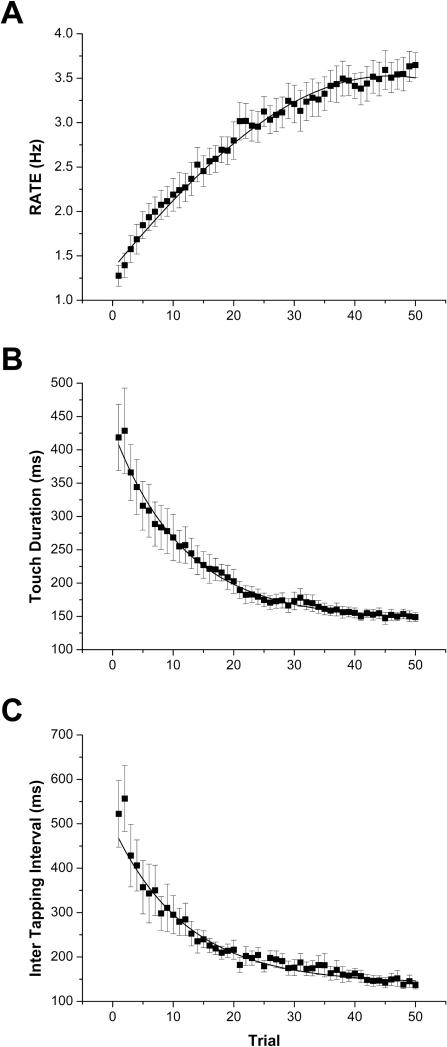
Figure 2.
Group-averaged motor parameters over the course of the motor sequence learning task (mean ± SE): A RATE, B Touch Duration (TD), C Inter Tapping Interval (ITI). The solid lines indicate the best fits to the data, representing the mean group learning curve: A Gaussian (y = y0 + (A/(w×√(π/2)))×exp(-2×((x-xc)/w)2), xc = 45.79 ± 3.841, w = 119.53 ± 99.83, R2 = 0.99), B Exponential (y = A1×exp(-x/t1) + y0, t1 = 11.83 ± 1.15, R2 = 0.98), C Exponential (y = A1×exp(-x/t1) + y0, t1 = 12.14 ± 1.34, R2 = 0.94).

