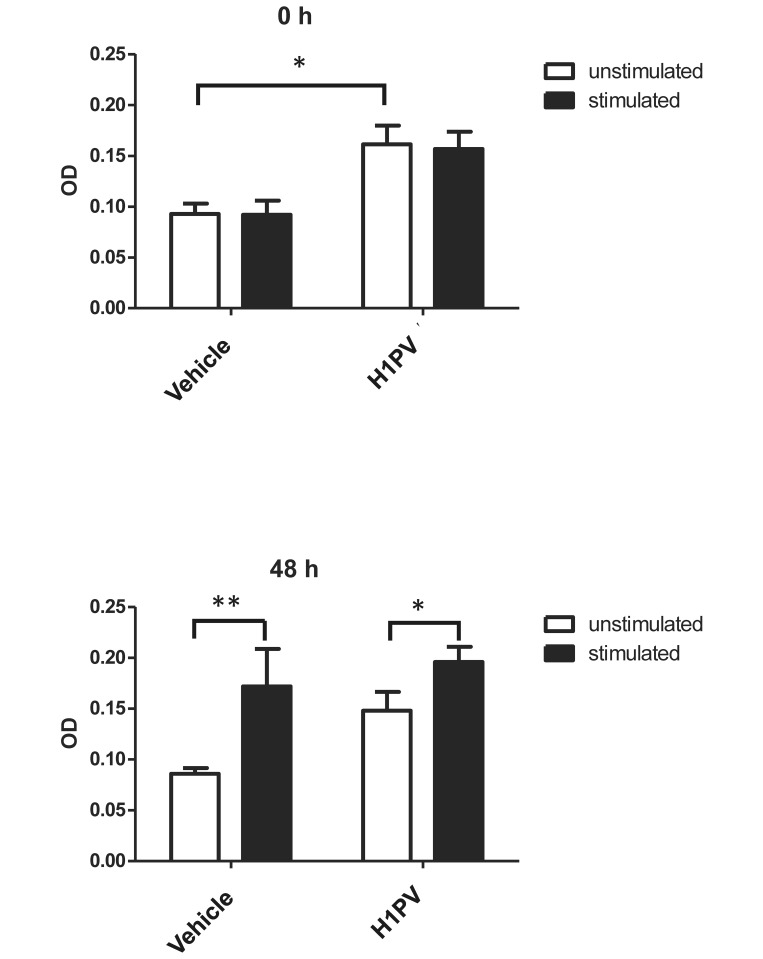
Figure 5.
Proliferation of PBMC after mitogenic stimulation. Optical density (OD) was measured at 570 nm at 2 time points (0 and 48 h after stimulation). Statistical analysis was performed using a 2-way ANOVA and a Bonferroni post test. *, Value significantly (P < 0.05) different from those for control groups. Results from male rats, which were analyzed individually, are shown. PBMC from female rats had to be pooled due to low cell numbers and showed similar effects to those in male rats (data not shown).

