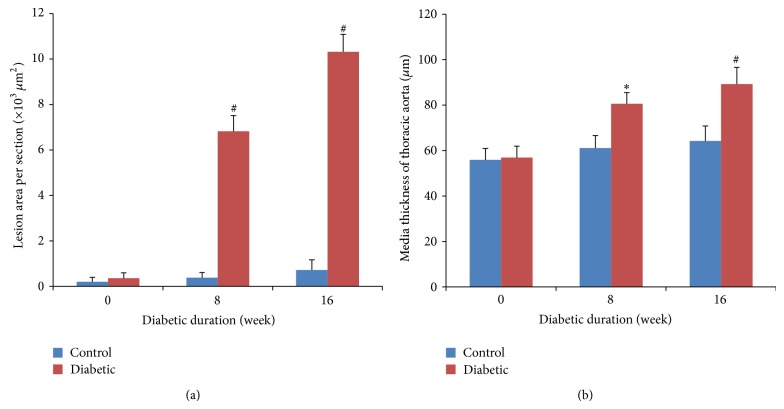
Figure 2.
Histological analysis of aortas. (a) Lesion areas (LA) of aorta from BALB/c mice at 0-, 8-, and 16-week diabetic duration. (b) Media thickness (MT) of the thoracic aorta from BALB/c mice at 0-, 8-, and 16-week diabetic duration. Data were obtained from 6 mice for each group. Data expressed as mean ± SEM. ∗ P < 0.05 versus age-matched control mice; # P < 0.01 versus age-matched control mice.

