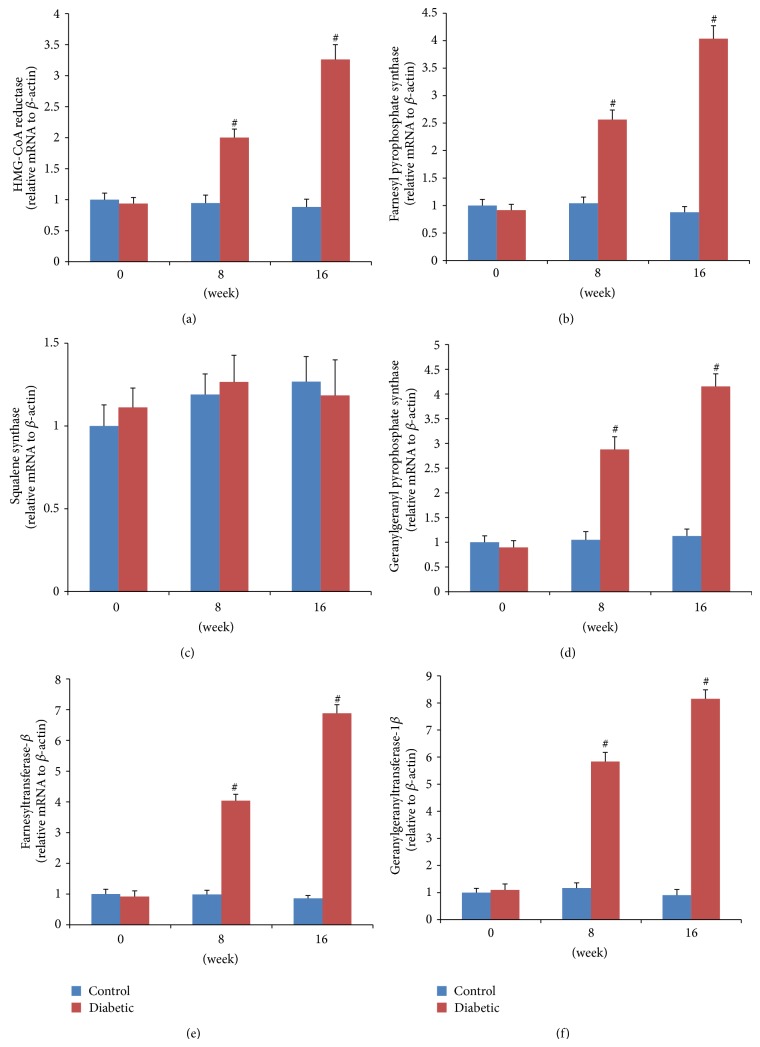
Figure 4.
Aortic mRNA expressions of key enzymes using QRT-PCR. The relative expression level of each sample was calibrated by the comparative threshold cycle method, using β-actin as an endogenous control. Data are expressed as fold changes (mean ± SEM), normalized to β-actin mRNA expression. ∗ P < 0.05 versus age-matched control mice; # P < 0.01 versus age-matched control mice.

