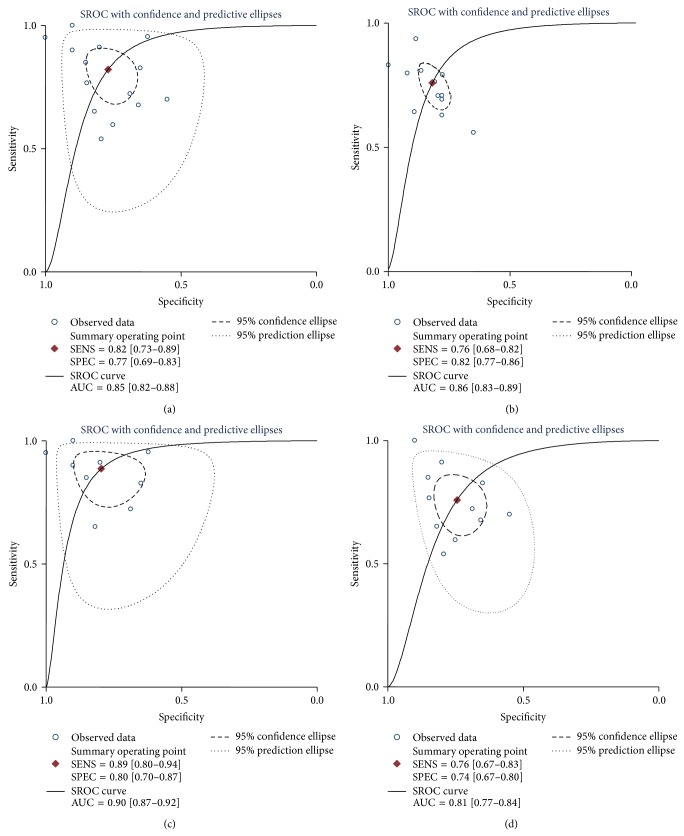
Figure 5.
The SROC curves of the pooled individual analyses. Sample size is indicated by the size of the square. The regression SROC curve indicates the overall diagnostic accuracy. (a) Single miR-155 test; (b) paneled miR-155 test; (c) serum-based miR-155 test; (d) Asian population-based miR-155 test. AUC: area under curve, Q: index; SE: standard error; SROC: summary receiver operator curve.

