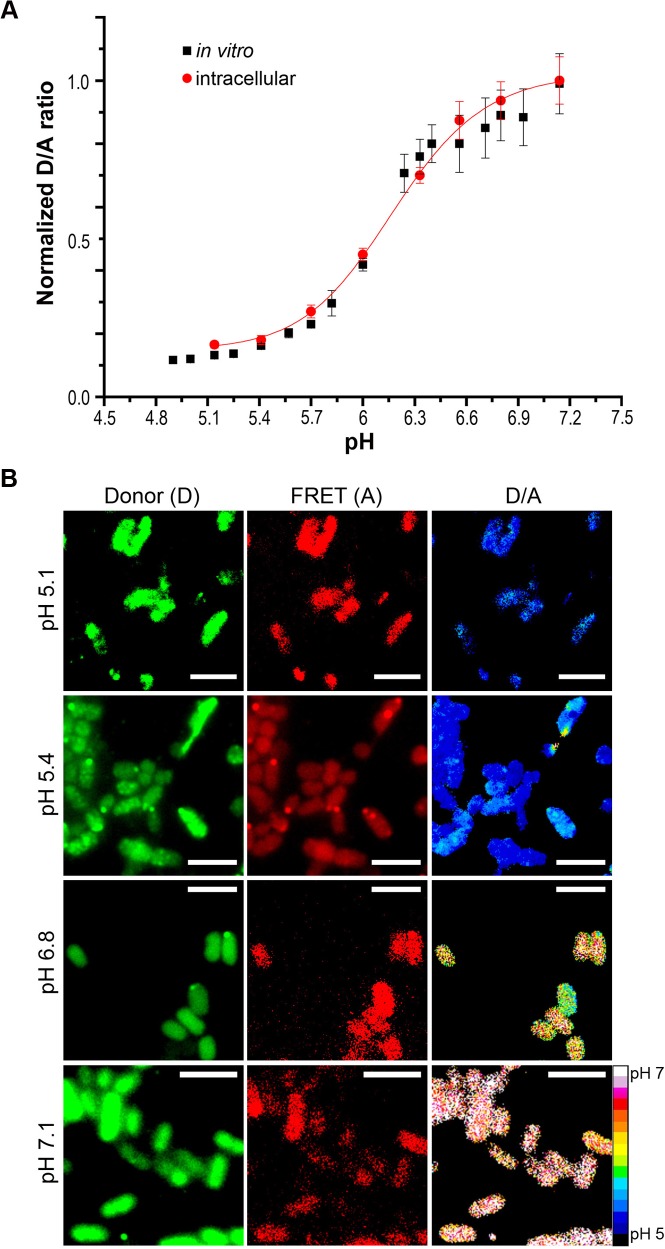
Fig 1. Functional integrity of the I-switch in Salmonella.
Wild-type (WT) Salmonella was electroporated with 6 μM I-switch and recovered in SOC for 1 h at 37°C, followed by three washes with PBS. Bacteria were then clamped at various pH values in K+-rich buffer containing 40 μM nigericin for 1 h at room temperature (RT) and imaged on an Applied Precision Delta Vision inverted wide-field fluorescence microscope. The fluorescence intensity of both donor and acceptor channels of 50 cells were measured for every pH value indicated in the figure. The ratio of D/A intensities were obtained and the normalized D/A ratios were plotted as a function of pH, which yielded a sigmoidal intracellular calibration curve (A). The intracellular curve is overlaid on the in vitro calibration curve. Error bars represent mean ± standard deviation (SD). (B) Representative Donor (D), FRET (A) and D/A ratio images of WT Salmonella clamped at various pH values. Scale bar, 3 μm, color scale, bottom, right. Pseudocolor images were generated by calculating the D/A ratio per pixel. Using ImageJ software, the pixels were then color-coded using 16 colors with blue (D/A = 0.1) to red (D/A = 1) to indicate the transition from acidic to neutral pH.

