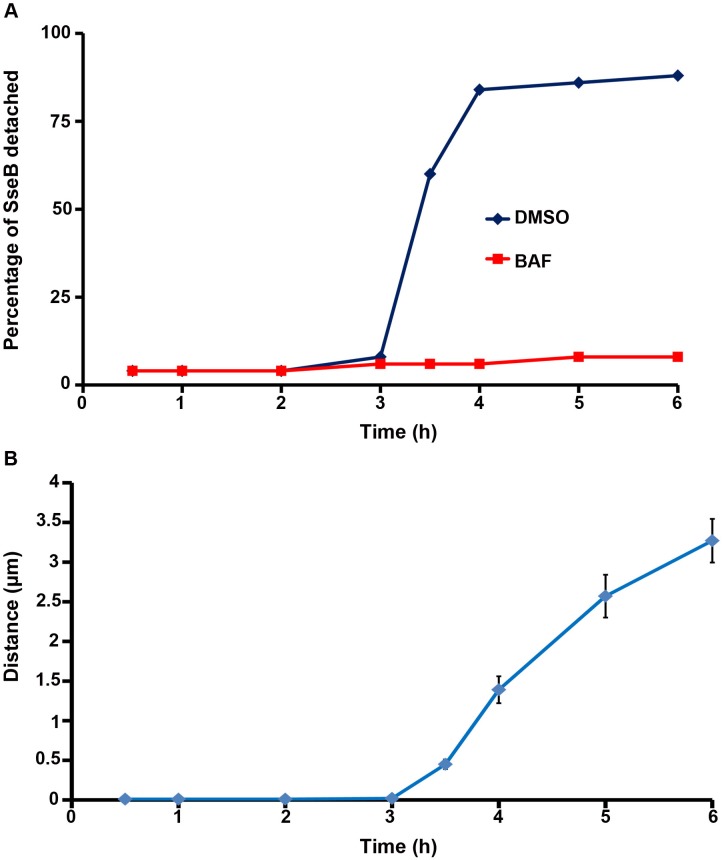
Fig 7. The percentage of detached SseB increased over time upon acidification.
(A) The percentage of detached SseB was plotted over time post-infection as described in the text. (B) The distance (in μm) of 50 SseB protein spots from the nearest bacterial cell surface was plotted as a function of time post-infection. Symbols are represented as the mean ± SEM.

