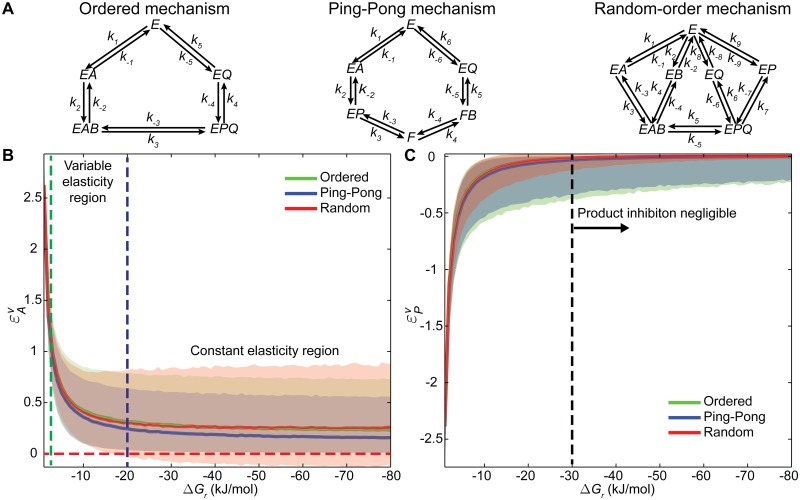
Fig 3. Revealing the impact of thermodynamics on enzyme kinetics.
(A) Schematic representation of the bimolecular mechanisms considered for the analysis. (B) Substrate elasticities for three mechanisms considered: ordered (green), ping-pong (blue) and random-order (red) at different Gibbs free energy differences of reaction ranging from -1 to -80 kJ/mol. Elasticities were calculated every -1 kJ/mol interval by sampling 104 instances each time. In this panel, each line represents the median of the respective elasticity distribution, while the shaded areas denote the 95% confidence regions. Depending on the chosen thermodynamic reference state, the elasticities can be almost constant for regions far from equilibrium (ΔG r <-20 kJ/mol) or highly variable close to equilibrium (dashed blue line). The dashed green line represents the limit for the lineal regime of substrate elasticity variation, while the dashed red line denotes the zero limit. (C) Product elasticities for the same representative bimolecular mechanisms. The lines and shaded areas represent the same as for the substrate elasticities. Product inhibition is on average negligible for favourable thermodynamic conditions, i.e. ΔG r < -30 kJ/mol (right side of the dashed blue line).

