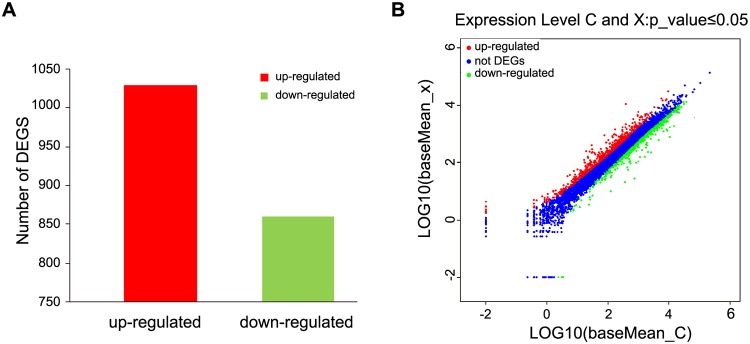
Fig 1. Differentially-expressed gene (DEGs) in different groups (P ≤0.05).

A. Totally 1890 differentially expressed genes were detected, of which 1030 were up-regulated and 860 were down-regulated (P ≤0.05). B. Differentially expressed genes. The red part represents the up-regulated genes in berberine hydrochloride-treated group compared to control group. The green part indicates the down-regulated genes in berberine hydrochloride-treated group. The blue part shows the genes without expression difference between these two samples.
