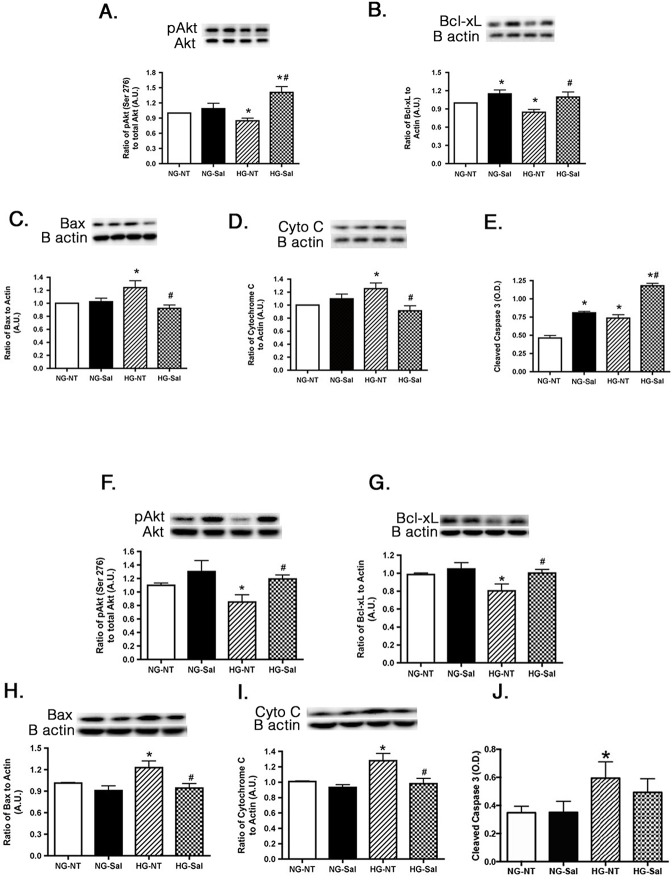
Fig 5. Apoptotic proteins are altered in REC and Müller cells cultured in high glucose and following salicylate treatment.
The top two graphs are western blot results of anti-apoptotic proteins in normal glucose (NG) or high glucose (HG) and either untreated (NT) or treated with salicylate (Sal). Data is represented as ratio of phosphorylated Akt (Ser 473) to total Akt (A,F) and that of Bcl-xL to β-actin (B,G) compared to normal glucose untreated (NG-NT). The bottom three graphs show the proapoptotic proteins in cells after the same treatments. Western blots of Bax (C,H) and Cytochrome C (D,I) as compared to β-actin and ELISA results of cleaved caspase 3 (E,J) are shown. Panels A-E represent REC data, while panels F-J present Müller cell data. A representative blot is shown for each western blot. *P<0.05 vs. NG-NT; #P<0.05 vs. HG-NT. Data are mean± SEM. N = 4 for each group.

