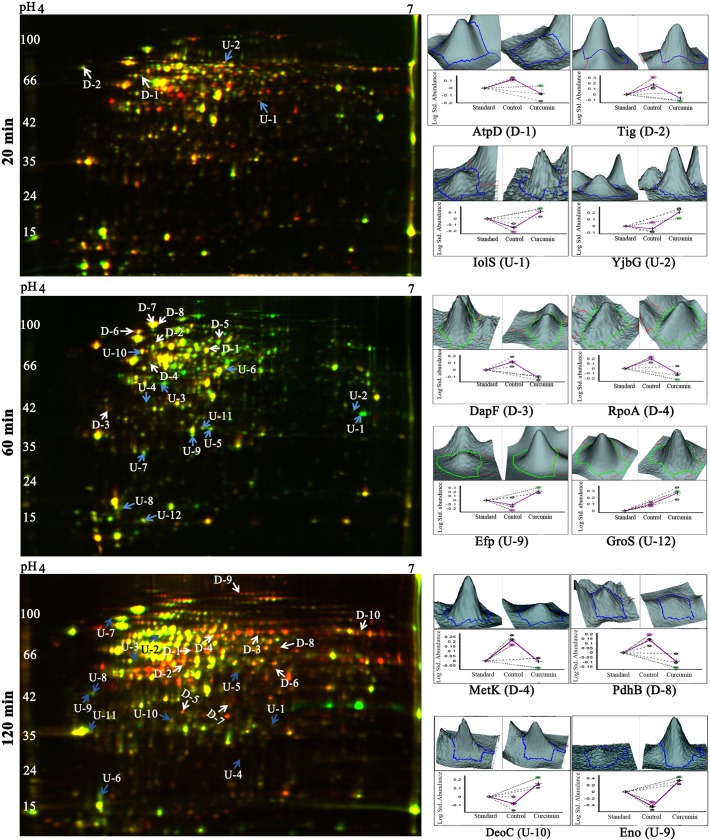
Fig 2. Temporal proteome changes of B. subtilis under curcumin treatment identified using 2D-DIGE.
Representative overlapped (Cy3 and Cy5) 2D-DIGE images of B. subtilis proteome in response to the curcumin treatment (20, 60 and 120 min). 60 μg of each sample; control, curcumin treated (20, 60 and 120 min) and internal standard were labelled with Cy3, Cy5 and Cy2, respectively (Dye swapping was performed). Proteins were separated in first dimension IEF on 24 cm IPG strips of pH 4–7 range followed by second dimension separation on 12.5% SDS-PAGE. 3D view and BVA graphs of selected differentially expressed proteins (p < 0.05) identified from each time point of curcumin treatment in 2D-DIGE are shown. Data is represented as mean ± SE (where n = 3).

