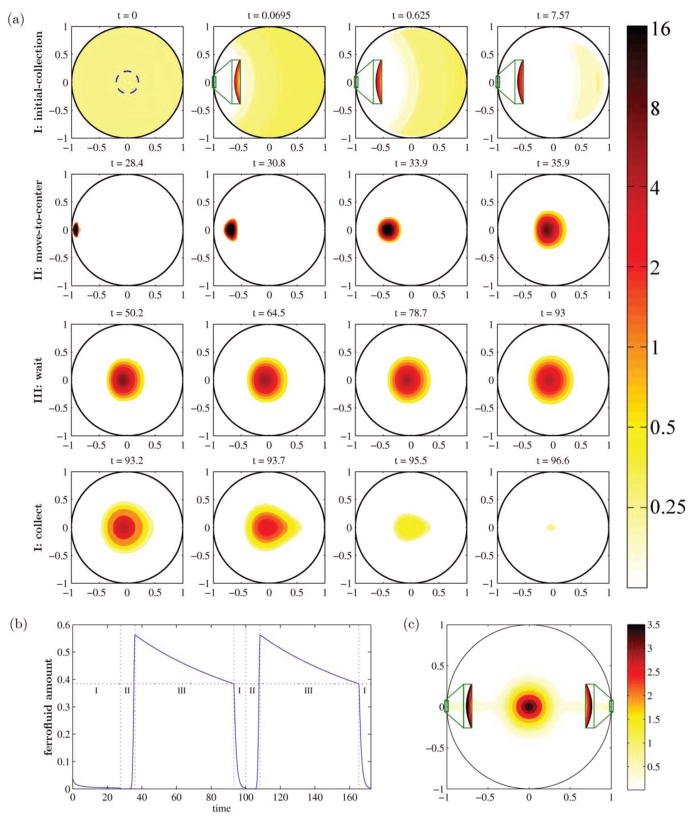
Figure 4.
Focusing a ferrofluid to a central target on average in a computer simulation. (a) The concentration of the controlled ferrofluid over time. In phase I, the ferrofluid is collected to the left edge (zooms shown in green boxes). In phase II it is brought to the center with minimal spreading by dynamic control of 8 magnets outside the circular domain (magnets not shown). Then there is a wait step (phase III) and then collection repeats on the right side. (b) The amount of ferrofluid inside the center target at each time. (c) The average ferrofluid concentration. Control achieves a clear hot-spot in the center. (For further details, please see (22). (© 2012 IEEE. Reprinted with permission, from (22), doi: 10.1109/MCS.2012.2189052).

