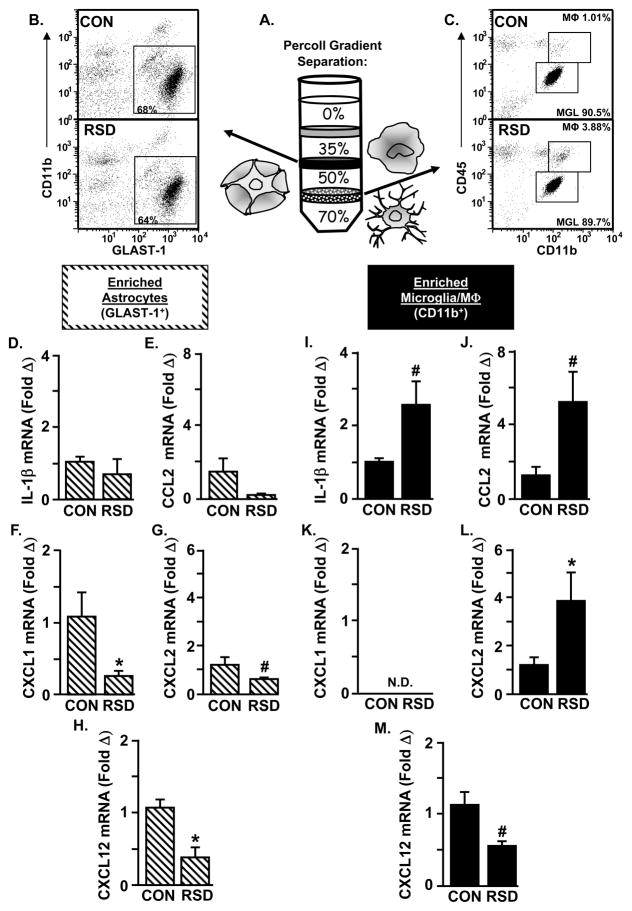
Figure 3. RSD increased IL-1β, CCL2, and CXCL2 expression in enriched microglia/macrophages, but not in astrocytes.
Male C57BL/6 mice were subjected to six cycles of social defeat (RSD) or left undisturbed as controls (CON). Enriched brain CD11b+ and GLAST-1+ cells were collected 14 h after the final cycle of RSD. A) Enriched brain CD11b+ and GLAST-1+ cells were collected using a Percoll density gradient. B) Representative bivariate dot plots of CD11b and GLAST-1 labeling of astrocytes and C) CD11b and CD45 labeling of microglia/macrophages are shown. The mRNA expression of D) IL-1β, E) CCL2, F) CXCL1, G) CXCL2, and H) CXCL12 was determined in enriched GLAST-1+ cells (n = 3–6). The mRNA expression of I) IL-1β, J) CCL2, K) CXCL1, L) CXCL2, and M) CXCL12 was determined in enriched CD11b+ cells (n = 3–6). Values represent average fold change compared to the respective control. Bars represent average ± SEM. Means with an asterisk (*) are significantly different from CON (p < 0.05) and means with a number sign (#) tended to be different from CON (p ≤ 0.1). (N.D., not detected).

