
Figure 4.
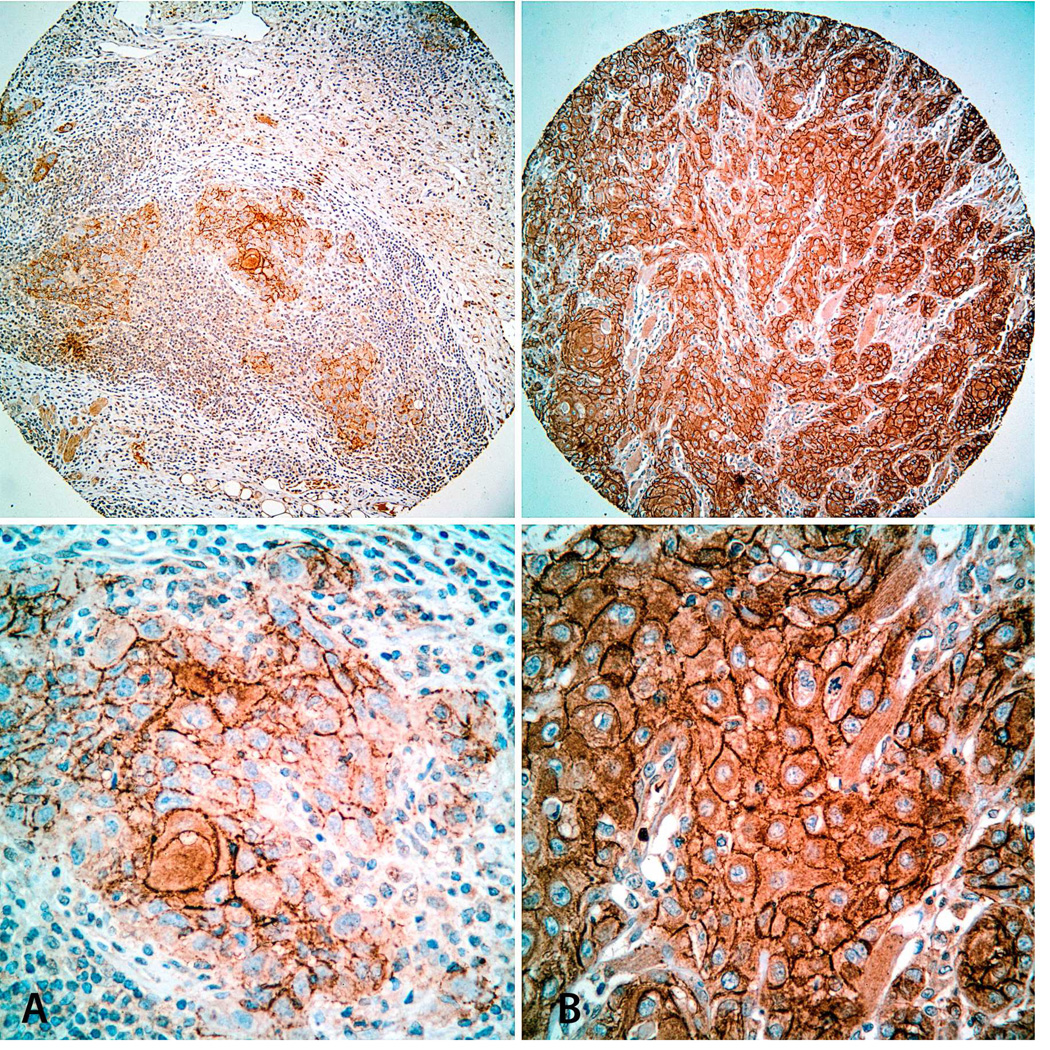
Immunohistochemical staining for CD44v6 in TMA cores. Representative images of SCCOT with low (A: Immunoscore = 1) and high (B: Immunoscore = 4) CD44v6 expression levels. Top: Low-power view (original magnification × 100); Bottom: High-power view of the same tumors (original magnification × 200).