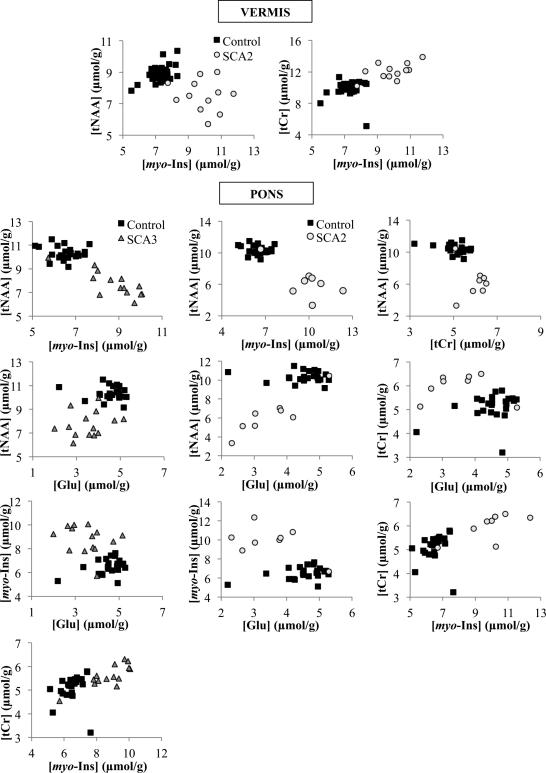
Figure 4.
Separation between patients with SCAs and controls by plotting the concentrations of neurochemicals against each other. The concentrations of metabolites that showed significant differences in patients – tNAA, tCr, myo-Ins and Glu – were plotted against each other to determine the ratio that could separate subjects into patient and control groups, with almost no overlap. SCA2 has the best separation with at most one dataset overlapping with controls.

