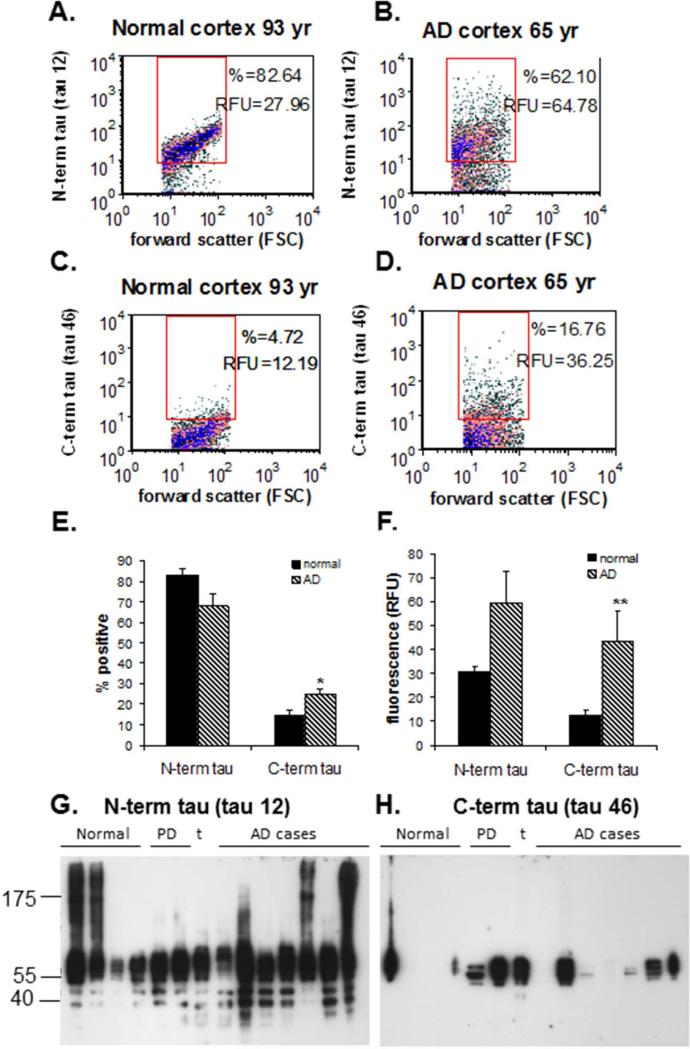
Fig. 3. C-terminal truncation of synaptic tau.
(A-F) Flow cytometry analysis for a series of aged normal controls (N = 3) and AD (N = 6) cases; data was collected from 5,000 terminals for each sample. Representative density plots are shown for a normal control (A) and an AD (B) sample immunolabeled with an antibody against the tau N-terminus (tau 12), and for a normal (C) and an AD (D) sample labeled for the tau C-terminus (tau 46) . (E) Percentage of synaptosomes detected with an intact N- and C-terminus; (F) Brightness of fluorescence for N- and C-terminal tau (RFU, relative fluorescence units); *p<0.05, ** p<0.01. (G-H) Western analysis of SDS-PAGE is shown for tau with an intact N-terminus (tau 12; G) and and intact C-terminus (tau 46; H) for a series of aged normal control (N = 4) and AD samples (N = 7). Controls include 2 Parkinson's disease cases and 1 tauopathy case (t); case information (same as for Fig. 2B) is presented in Table 2.

