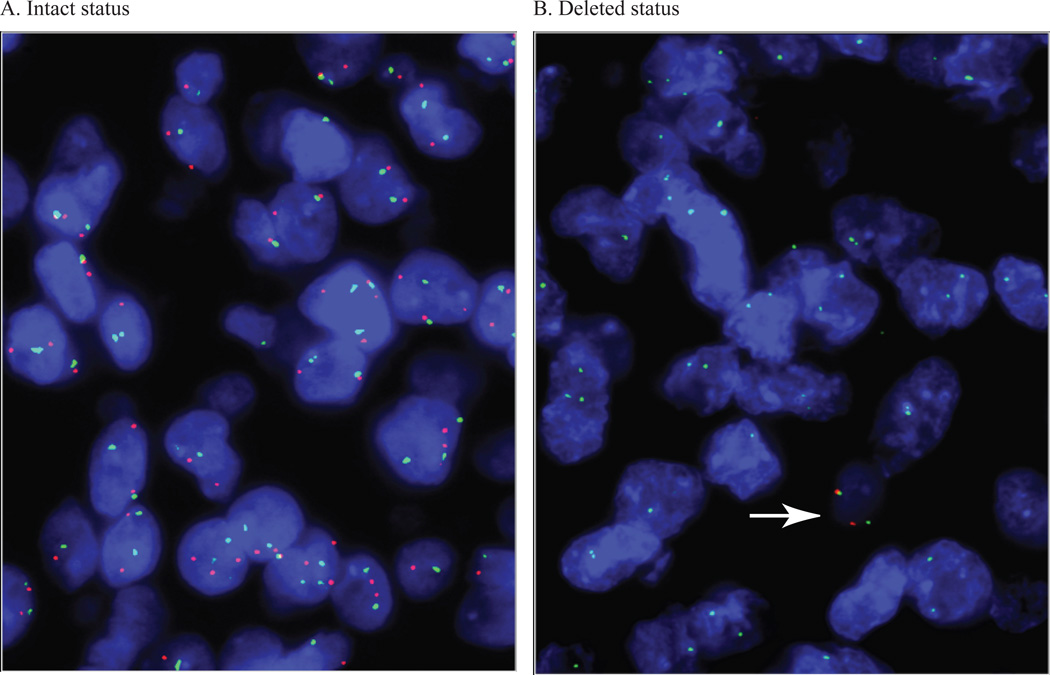
Figure 1. Fluorescence in situ hybridization for CDKN2A.
(A, B) Results of fluorescence in situ hybridization demonstrating intact (A: CEP9/CDKN2A ratio near one) and deleted (B) CDKN2A status. In the latter case, a non-neoplastic cell containing 2 green CEP9 signals and 2 red CDKN2A signals is seen (white arrow), whereas all the tumor cells have only CEP9 signals.

