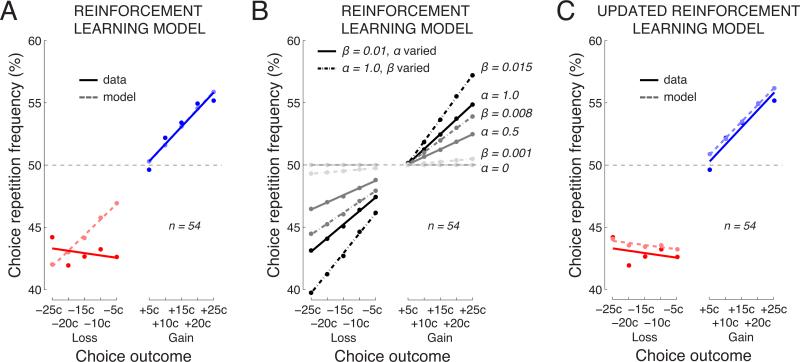
Fig. 5. A mechanistic account of the choice behavior using a Reinforcement Learning model.
A) Behavior of the subjects and of a Reinforcement Learning model. The figure shows the mean choice repetition frequency as a function of the outcome magnitude, for the subjects (dark solid) and the model (light dashed). The model was fitted separately to the data of individual subjects, and the average is shown.
B) Effects of varying parameters in the Reinforcement Learning model. The individual data points and lines represent the individual combinations of parameter values. The parameter values are given next to each line on the right.
C) Same as in A but for a Reinforcement Learning model in which the outcome is modeled as a constant for all trials that follow a loss (see text for details).

