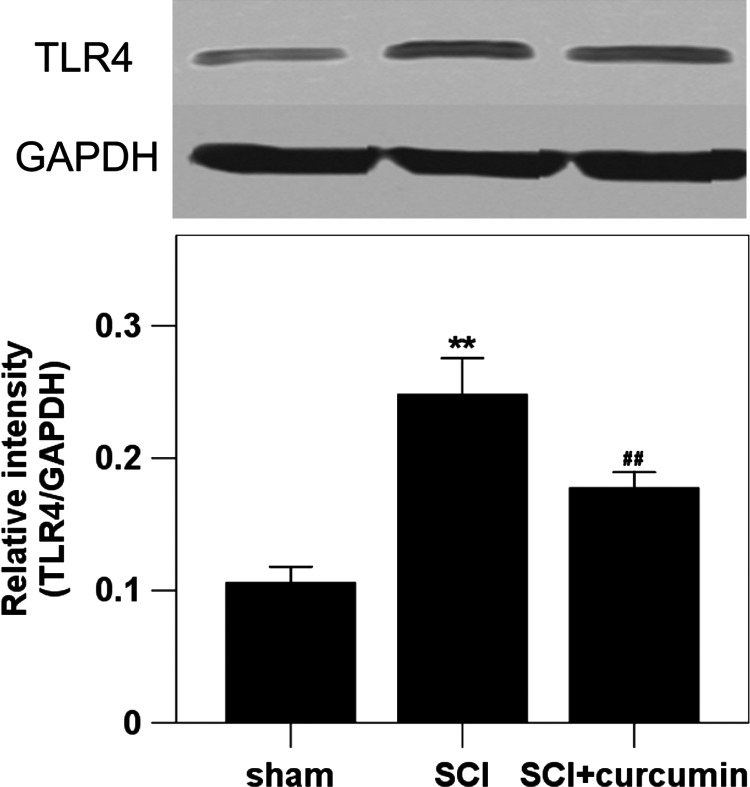
Figure 2 .
Spinal cord TLR4 protein expression in sham group, SCI group and SCI + curcumin group by western blot analysis (n = 8 per group). Upper, Representative autoradiogram of the TLR4 protein expression by western blot. We detected TLR4 at 89 kDa and the loading control GAPDH at 36 kDa. Bottom, Quantitative analysis of the western blot results for the expression of TLR4. The figure shows that the protein expression of TLR4 in the spinal cords was significantly increased after SCI and could be suppressed when treated with curcumin. **P < 0.01 versus sham group; ##P < 0.01 versus SCI group.

