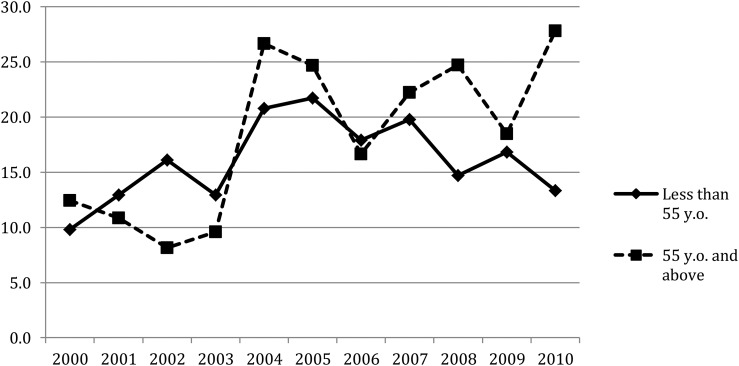
Figure 1 .
Annual incidence of T-SCI referred to our Center in Québec, Canada. Figure showing the variation over time of the incidence (in cases per million population) of T-SCI in Québec, Canada from 2000 to 2010. Two groups are represented: individuals aged <55-years-old (diamonds) and individuals ≥55-years-old (squares) with the older group becoming more frequently affected by T-SCI over time.

