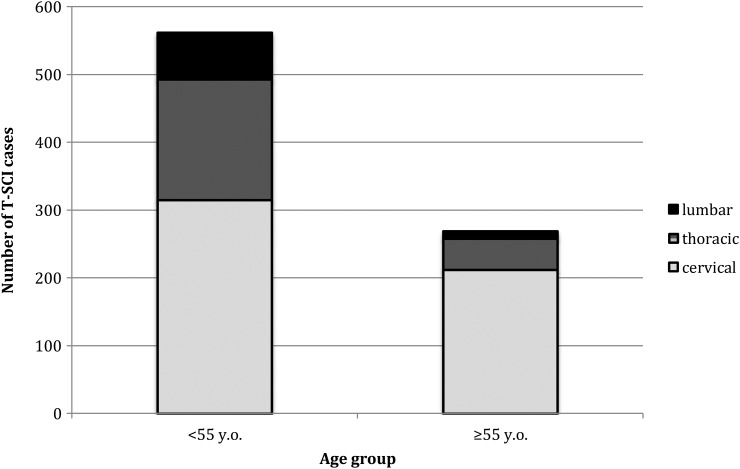
Figure 3 .
Level of SCI (cervical, thoracic, or lumbar) as a function of age. Figure illustrating the proportion of cervical (gray), thoracic (horizontal bars), and lumbar (black) levels of SCI according to age. On the left is the younger population (<55 years) and on the right is the older population (≥55 years), showing an increased proportion of cervical-level injuries with increasing age.

