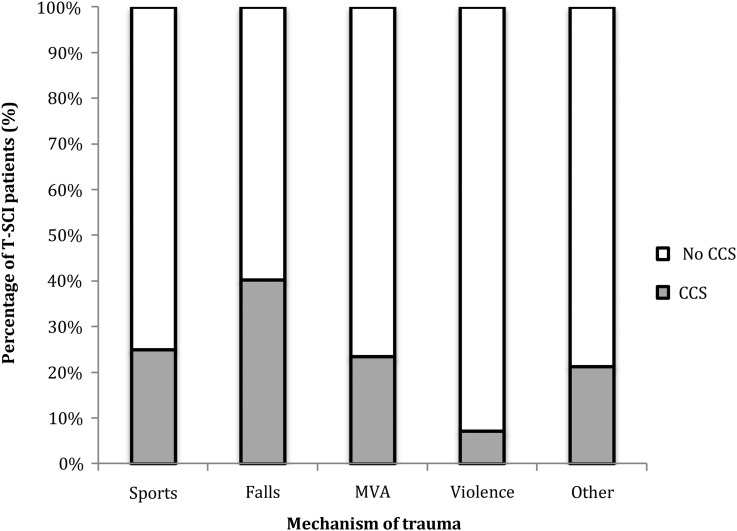
Figure 4 .
Percentage of individuals with T-SCI who sustain CCS: a breakdown by etiology of trauma. The percentage of individuals with CCS (in gray) is expressed as part of the whole T-SCI (in white) population and divided according to etiology of trauma. The proportion of individuals with CCS clearly varies according to trauma etiology and simple falls incur the highest risk of CCS.

