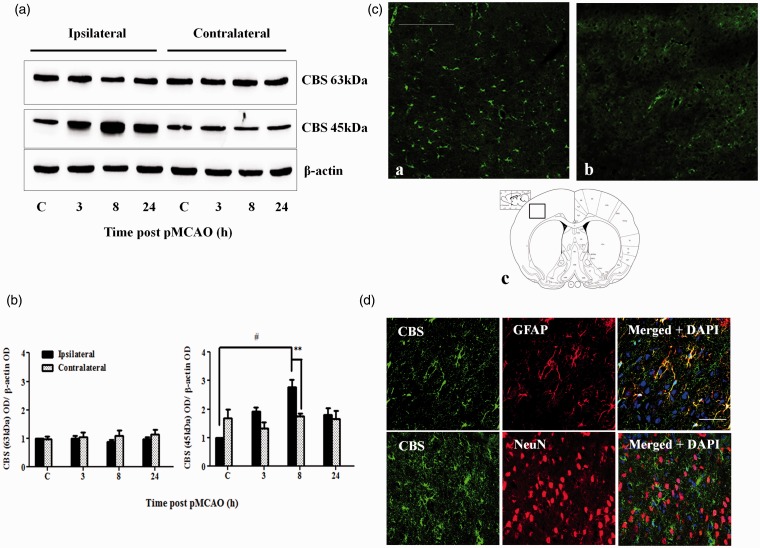
Figure 5.
CBS expression in the cerebral cortex after pMCAO. (a) Representative Western blot results on CBS expression at 3 to 24 hr post-pMCAO in the cerebral cortex. (b) Densitometry measurement of CBS expression over 24 hr after pMCAO. Protein expression is expressed relative to the ipsilateral control C. Data are presented as mean ± SEM, n = 3–4. ANOVA for CBS 63 kDa on the ipsilateral side: F(3, 12) = 0.608, p = .623. ANOVA for CBS 45 kDa on the ipsilateral side: F(3, 8) = 6.702, p < .05; #p < .05 against ipsilateral control by Bonferroni; **p < .005 against the contralateral side by independent t test. (c) Immunofluorescent staining of CBS showed increased CBS expression in the cortex 8 hr after pMCAO (a) compared with sham-control rats (b). Scale bar: 200 µm. (c) shows the location where the CBS immunofluorescent photomicrographs were taken. (d) Colocalization of CBS (green) and GFAP (red, top panel) and lack of colocalization of CBS (green) and NeuN (red, bottom panel) in the cortex at 8 hr after pMCAO. Scale bar: 50 µm. CBS = cystathionine β-synthase; pMCAO = permanent middle cerebral artery occlusion; ANOVA = analysis of variance.

