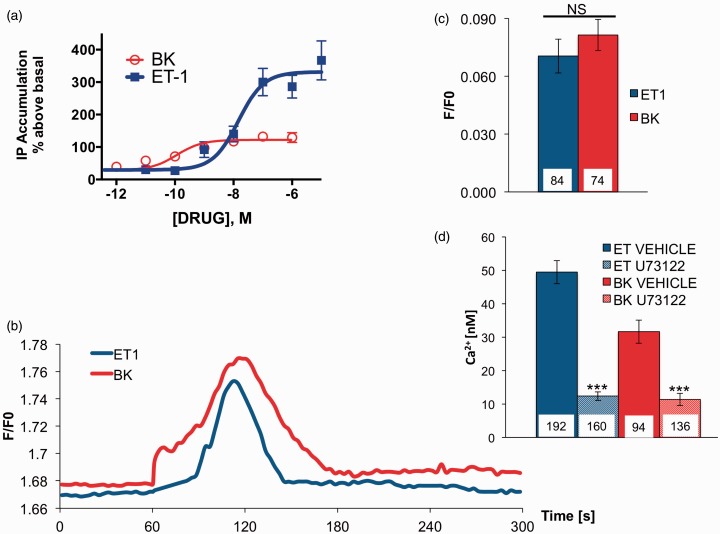
Figure 3.
ET-1- and BK-induced activation of PLC in population and single-cell measurements. A. TG cultures were incubated for 30 min (37 ℃) with the indicated concentration of ET-1 or BK. Total accumulation of IP was determined as described in Methods section. Data shown are the mean percentage above basal IP accumulation ± SEM, n = 6. (b) TG neurons nucleofected with GFP-PLC∂-PH and underwent ET-1 (100 nM) or BK (100 nM) stimulation. Translocation of membrane-localized PLC∂-PH to the cytosol reports PIP2 hydrolysis by ET-1 (100 nM) or BK (100 nM) stimulation. Normalized (to the background values) cytosolic GFP fluorescence excited at 470 nm during ET-1 and BK stimulation is displayed. (c) Summary of net change in GFP cytosolic fluorescence during ET-1 and BK application. (d) Summary of Ca2+measurements of store-operated Ca2+ entry in TGs. Ca2+ entry was induced by store depletion by stimulation of cells with ET-1 (100 nM) or BK (100 nM) in the presence or absence of U73122 (10 µM, PLC inhibitor). Statistical significance was assessed by unpaired t-test, or two-way ANOVA with Bonferroni post hoc correction, *p < .05. **p < .01. ***p < .001. ET-1 = endothelin-1; BK = bradykinin; PLC = phospholipase C; IP = inositol monophosphate; SEM = standard error of the mean; ANOVA = analysis of variance; PIP2 = phosphatidylinositol 4,5-bisphosphate; GFP = green fluorescent protein.

