
Figure 1.
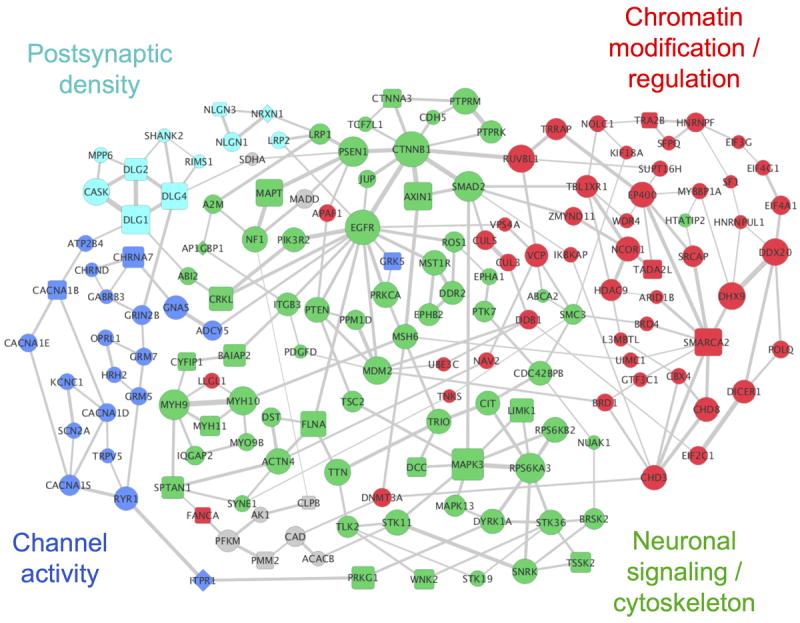
The network implicated by NETBAG+ based on ASD-associated de novo SNVs and CNVs from recent studies (network is comprised of 159 genes; P = 0.036). Node sizes are proportional to the contributions of each gene to the overall network score, and edge widths are proportional to the likelihood that the corresponding gene pair contributes to the same genetic phenotype (see Methods). For clarity, only the two strongest edges for each gene are shown. Node shapes indicate types of the corresponding mutations: circles represent genes from SNVs, squares represent genes from CNVs, and diamonds represent genes affected by both mutation types. The network was divided into cohesive functional clusters (indicated by node colors) using hierarchical clustering; general functions of these clusters determined using DAVID are shown in the figure (see Supplementary Table S3 for a complete list of GO terms associated with each cluster). Grey nodes represent genes that are not members of the network clusters.