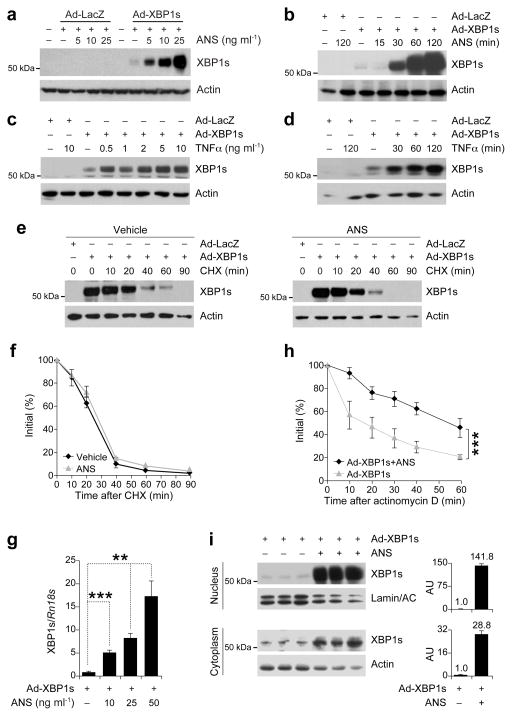
Figure 1.
SAPK signaling increases XBP1s mRNA stability and nuclear translocation. (a) XBP1s protein levels in the MEFs infected with adenoviruses expressing LacZ (Ad-LacZ) or XBP1s (Ad-XBP1s) and treated with anisomycin (ANS) at indicated concentrations for 2h. (b) XBP1s protein levels from MEFs infected with Ad-LacZ or Ad-XBP1s and treated with ANS (25 ng ml−1) for 15, 30, 60 and 120 min. (c–d) XBP1s immunoblotting in MEFs infected with Ad-LacZ or Ad-XBP1s and treated with TNFα (c) for 2 h at increasing concentrations or (d) at 10 ng ml−1 concentration for 30, 60 and 120 min. (e) XBP1s protein degradation rate in MEFs infected with Ad-LacZ or Ad-XBP1s, treated with vehicle or ANS (25 ng ml−1) for 2 h then subjected to cycloheximide (CHX) (10 μg ml−1) for indicated time points. XBP1s protein levels were determined by direct immunoblotting of the whole cell lysates. (f) XBP1s protein/actin ratio before and at indicated times after CHX treatment. (g) XBP1s mRNA levels after ANS stimulation. MEFs were infected with Ad-XBP1s and subsequently treated with ANS for 1 h at indicated concentrations. (h) XBP1s mRNA levels at indicated time points after addition of actinomycin D (10 μg ml−1) to the MEFs infected with Ad-XBP1s and stimulated with ANS (25 ng ml−1) for 1 h. (i) Cytoplasmic and nuclear XBP1s protein levels from MEFs infected with Ad-XBP1s and exposed to ANS (25 ng ml−1) for 2 h. Graph adjacent to each blot depicts the ratio of XBP1s in ANS- versus vehicle-treated cells. Each experiment was independently reproduced three times. Error bars are ±S.E.M. Significance was determined by two-way analysis of variance (ANOVA) with Bonferroni multiple-comparison analysis (Figures 1f and 1h) or Student’s t-test (Figure 1g) (**P<0.01, ***P<0.001).

